The Drowned World

[Image: From Terra Forming: Engineering the Sublime by Adam Lowe and Jerry Brotton].

Artists Adam Lowe and Jerry Brotton’s project Terra Forming: Engineering the Sublime simultaneously explores the history of different geographic projections—including how these have been used to misrepresent and distort the earth’s surface—and at the future of that earth in an era of rising sea levels.

[Image: From Terra Forming: Engineering the Sublime by Adam Lowe and Jerry Brotton].

As Factum Arte explain, their chosen geographic projections offer “a way of engaging with the Earth from different points of view, and reflect historical ways of mapping the world from the Greeks to Google Earth.”

[Image: From Terra Forming: Engineering the Sublime by Adam Lowe and Jerry Brotton].

The projections are milled into beautiful 3D topographic models, with the vertical axis exaggerated to allow for changes in altitude to become visible.

The Andes, for example, become an abrupt spine of skyscraping pinnacles on the edge of an otherwise dead-flat continent, and deep-sea plains become spiky fields of underwater needles and pins.

[Images: From Terra Forming: Engineering the Sublime by Adam Lowe and Jerry Brotton].

As the artists write, “distortion was used because without it the globe’s surface would appear almost totally flat”—which interestingly suggests that representational distortion, with a great deal of irony, is actually central to giving our planet geographic legibility.

To map it or to know it, the implication seems to be, you must first alter it.

[Image: From Terra Forming: Engineering the Sublime by Adam Lowe and Jerry Brotton].

This is only half the project, however.

The artists refer to Terra Forming as “a cartographic response to the advent of the Anthropocene“—which is why the resulting topographic models are then flooded.

[Images: From Terra Forming: Engineering the Sublime by Adam Lowe and Jerry Brotton].

“The installation will mimic the passage of time as well as space,” Factum Arte write, “by flooding the world with water over several days, until we reach current sea levels; the world will then be flooded completely, leaving us with a drowned world, a prescient image for those parts of the world facing rising sea levels, as well as those such as parts of the Arabian Peninsula which is trying to reclaim land from the sea.”

You can watch a short video of the project’s gradual submergence on Vimeo—or embedded below.


And you can read much more about the project over at Factum Arte.

Landscapes of Inevitable Catastrophe

[Image: Illustration by David McConochie, courtesy of The Art Market, via The Guardian].

Last month, The Economist reported on the widespread presence of radioactive tailings piles—waste rock left over from Soviet mining operations—in southern Kyrgyzstan. Many of the country’s huge, unmonitored mountains of hazardous materials are currently leaching into the local water supply.

In a particularly alarming detail, even if you wanted to avoid the danger, you might not necessarily know where to find it: “Fences and warning signs have been looted for scrap metal,” we read.

Frequent landslides and seasonal floods also mean that the tailings are at risk of washing downriver into neighboring countries, including into “Central Asia’s breadbasket, the Fergana Valley, which is home to over 10m people… A European aid official warns of a ‘creeping environmental disaster.'”

Attempts at moving the piles have potentially made things worse, releasing “radioactive dust” that might be behind a spike in local cancers.

In addition to the sheer aesthetic horror of the landscape—a partially radioactive series of river valleys, lacking in warning signs, that writer Robert Macfarlane would perhaps call “eerie,” a place where “suppressed forces pulse and flicker beneath the ground and within the air… waiting to erupt or to condense”—it’s worth noting at least two things:

One, there appears to be no end in sight; as The Economist points out, the neighboring countries “are hardly on speaking terms, so cross-border co-operation is non-existent,” and the costs of moving highly contaminated mine waste are well out of reach for the respective governments.

This means we can more or less confidently predict that, over the coming decades, many of these tailings piles will wash away, slowly but relentlessly, fanning out into the region’s agricultural landscape.

Once these heavy metals and flecks of uranium have dispersed into the soil, silt, and even plantlife, they will be nearly impossible to re-contain; this will have effects not just over the span of human lifetimes but on a geological timescale.

Second, most of these piles are unguarded: unwatched, unmonitored, unsecured. They contain radioactive materials. They are in a region known for rising religious extremism.

Given all this, surely finding a solution here is rather urgent, before these loose mountains of geological toxins assume an altogether more terrifying new role in some future news cycle—at which point, in retrospect, articles like The Economist‘s will seem oddly understated.

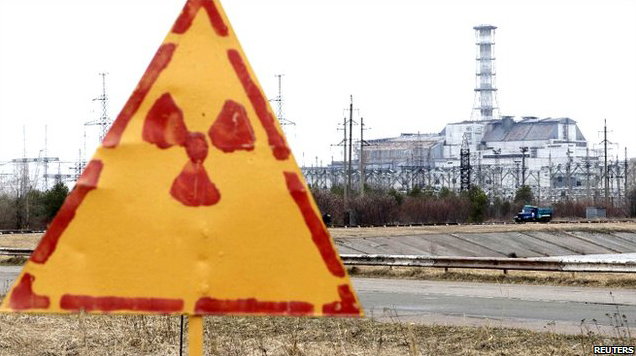
[Image: Hand-painted radiation sign at Chernobyl, via the BBC].

Indeed, our ability even to comprehend threats posed on a geologic timescale—let alone to act on those threats politically—is clearly not up to the task of grappling with events or landscapes such as these.

To go back to Robert Macfarlane, he wrote another article earlier this year about the specialized vocabulary that has evolved for naming, describing, or cataloging terrestrial phenomena. By contrast, he suggests, we now speak with “an impoverished language for landscape” in an era during when “a place literacy is leaving us.”

As Macfarlane writes, “we lack a Terra Britannica, as it were: a gathering of terms for the land and its weathers—terms used by crofters, fishermen, farmers, sailors, scientists, miners, climbers, soldiers, shepherds, poets, walkers and unrecorded others for whom particularised ways of describing place have been vital to everyday practice and perception.”

Channeling Macfarlane, where is the vocabulary—where are our cognitive templates—for describing and understanding these landscapes of long-term danger and slow catastrophe?

It often seems that we can stare directly into the wasteland without fear, not because there is nothing of risk there, but because our own words simply cannot communicate the inevitability of doom.

The Town That Creep Built

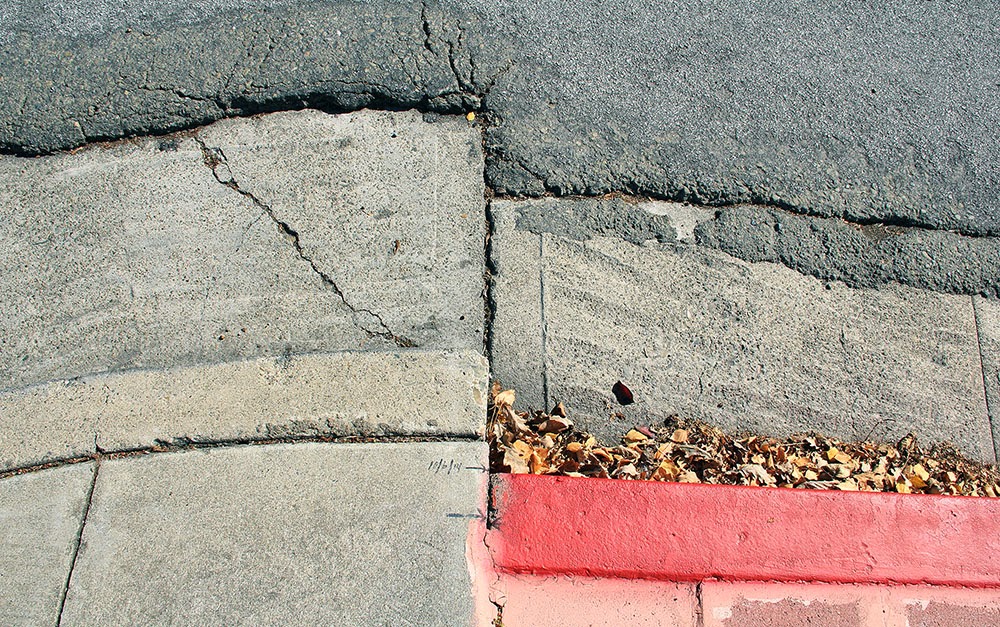
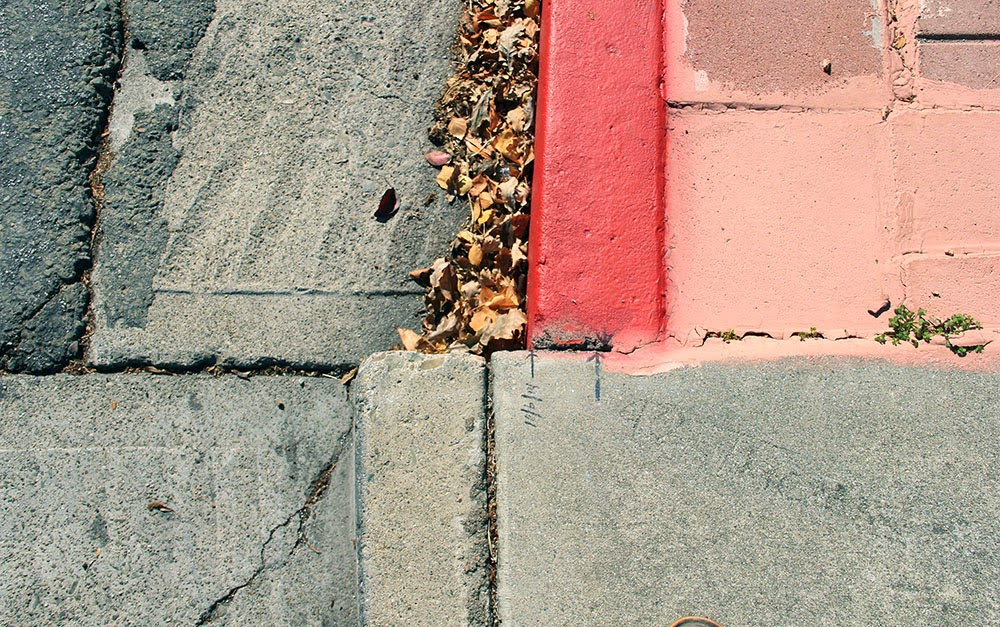
[Image: A curb in Hayward reveals how much the ground is drifting due to “fault creep”: the red-painted part is slowly, but relentlessly, moving north. Photo by Geoff Manaugh].

South of San Francisco, a whole town is being deformed by plate tectonics. These are the slow but relentless landscape effects known as “fault creep.”

An earlier version of this post was first published on The Daily Beast.

The signs that something’s not right aren’t immediately obvious, but, once you see them, they’re hard to tune out.

Curbs at nearly the exact same spot on opposite sides of the street are popped out of alignment. Houses too young to show this level of wear stand oddly warped, torqued out of synch with their own foundations, their once strong frames off-kilter. The double yellow lines guiding traffic down a busy street suddenly bulge northward—as if the printing crew came to work drunk that day—before snapping back to their proper place a few feet later.

This is Hollister, California, a town being broken in two slowly, relentlessly, and in real time by an effect known as “fault creep.” A surreal tide of deformation has appeared throughout the city.

[Image: “Fault creep” bends the curbs in Hollister; photo by Geoff Manaugh].

As if its grid of streets and single-family homes was actually built on an ice floe, the entire west half of Hollister is moving north along the Calaveras Fault, leaving its eastern streets behind.

In some cases, doors no longer fully close and many windows now open only at the risk of getting stuck (some no longer really close at all).

Walking through the center of town near Dunne Park offers keen observers a hidden funfair of skewed geometry.

[Image: 359 Locust Avenue, Hollister; photo by Geoff Manaugh].

For example, go to the house at 359 Locust Avenue.

The house itself stands on a different side of the Calaveras Fault than its own front walkway. As if trapped on a slow conveyor built sliding beneath the street, the walk is being pulled inexorably north, with the effect that the path is now nearly two feet off-center from the porch it still (for the time being) leads to.

[Image: The walkway is slowly creeping north, no longer centered with the house it leads to; photo by Geoff Manaugh].

In another generation, if it’s not fixed, this front path will be utterly useless, leading visitors straight into a pillar.

Or walk past the cute Victorian on 5th Street. Strangely askew, it seems frozen at the start of an unexpected metamorphosis.

[Image: Photo by Geoff Manaugh].

Geometrically, it’s a cube being forced to become a rhomboid by the movements of the fault it was unknowingly built upon, an architectural dervish interrupted before it could complete its first whirl.

Now look down at your feet at the ridged crack spreading through the asphalt behind you, perfectly aligned with the broken curbs and twisted homes on either side.

This is the actual Calaveras Fault, a slow shockwave of distortion forcing its way through town, bringing architectural mutation along with it.

[Images: The Calaveras Fault pushes its way through Hollister; photos by Geoff Manaugh].

The ceaseless geometric tumult roiling just beneath the surface of Hollister brings to mind the New Orleans of John McPhee, as described in his legendary piece for The New Yorker, “Atchafalaya.”

There, too, the ground is active and constantly shifting—only, in New Orleans, it’s not north or south. It’s up or down. The ground, McPhee explains, is subsiding.

“Many houses are built on slabs that firmly rest on pilings,” he writes. “As the turf around a house gradually subsides, the slab seems to rise.” This leads to the surreal appearance of carnivalesque spatial side-effects, with houses entirely detached from their own front porches and stairways now leading to nowhere:

Where the driveway was once flush with the floor of the carport, a bump appears. The front walk sags like a hammock. The sidewalk sags. The bump up to the carport, growing, becomes high enough to knock the front wheels out of alignment. Sakrete appears, like putty beside a windowpane, to ease the bump. The property sinks another foot. The house stays where it is, on its slab and pilings. A ramp is built to get the car into the carport. The ramp rises three feet. But the yard, before long, has subsided four. The carport becomes a porch, with hanging plants and steep wooden steps. A carport that is not firmly anchored may dangle from the side of a house like a third of a drop-leaf table. Under the house, daylight appears. You can see under the slab and out the other side. More landfill or more concrete is packed around the edges to hide the ugly scene.

Like McPhee’s New Orleans, Hollister is an inhabitable catalog of misalignment and disorientation, bulging, bending, and blistering as it splits right down the middle.

And there’s more. Stop at the north end of 6th Street, for example, just across from Dunne Park, and look back at the half-collapsed retaining wall hanging on for dear life in front of number 558.

It looks like someone once backed a truck into it—but it’s just evidence of plate tectonics, the ground bulging northward without regard for bricks or concrete.

[Images: A fault-buckled wall and sidewalk bearing traces of planetary forces below; photos by Geoff Manaugh].

In fact, follow this north on Google Maps and you’ll find a clean line connecting this broken wall to the jagged rupture crossing the street in the photographs above, to the paper-thin fault dividing the house from its own front walk on Locust Avenue.

So what’s happening to Hollister?

“Fault creep” is a condition that results when the underlying geology is too soft to get stuck or to accumulate tectonic stress: in other words, the deep rocks beneath Hollister are slippery, more pliable, and behave a bit like talc. Wonderfully but unsurprisingly, the mechanism used to study creep is called a creepmeter.

The ground sort of oozes past itself, in other words, a slow-motion landslide at a pace that would be all but imperceptible if it weren’t for the gridded streets and property lines being bent out of shape above it.

[Image: A curb and street drain popped far out of alignment in Hollister; photo by Geoff Manaugh].

In a sense, Hollister is an urban-scale device for tracking tectonic deformation: attach rulers to its porches and curbs, and you could even take measurements.

The good news is that the large and damaging earthquakes otherwise associated with fault movement—when the ground suddenly breaks free every hundred years or so in a catastrophic surge—are not nearly as common here.

Instead, half a town can move north by more than an inch every five years and all that most residents will ever feel is an occasional flutter.

[Images: Crossing onto the Pacific Plate (heading west) in Parkfield; photo by Geoff Manaugh].

I spoke with Andy Snyder from the U.S. Geological Survey about the phenomenon.

Snyder works on an experiment known as the San Andreas Fault Observatory at Depth, or SAFOD, which has actually drilled down through the San Andreas Fault to monitor what’s really happening down there, studying the landscape from below through sensitive probes installed deep in the active scar tissue between tectonic plates.

On Snyder’s advice, I made my way out to one of the greatest but most thoroughly mundane monuments to fault creep in the state of California. This was in Parkfield, a remote town with a stated population of 18 where Snyder and SAFOD are both based, and where fault creep is particularly active.

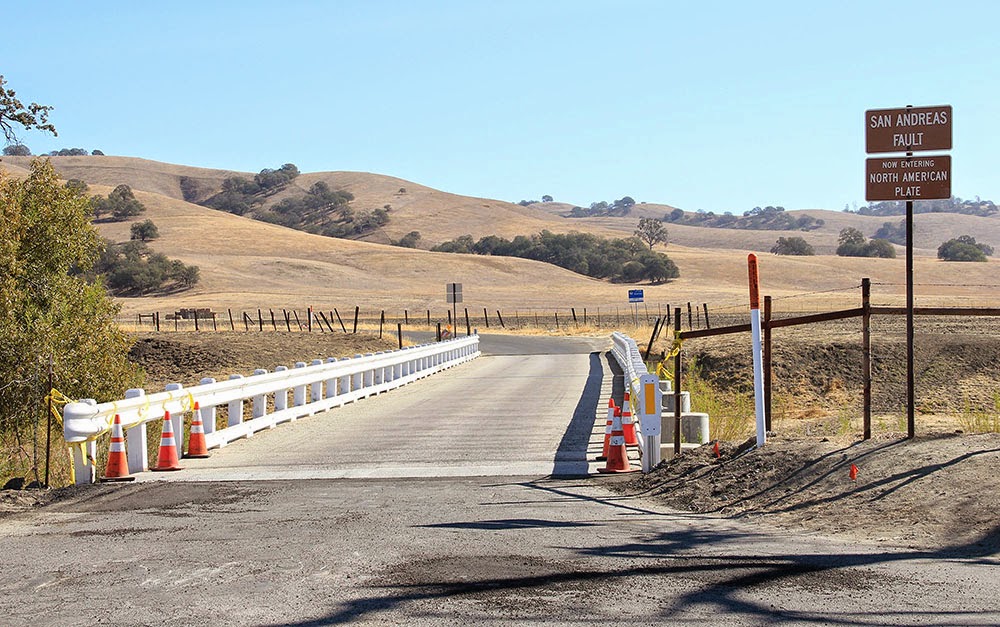
In Parkfield there is a remarkable road bridge: a steel structure that has been anchored to either side of the San Andreas Fault like a giant, doomed staple. Anyone who crosses it in either direction is welcomed onto a new tectonic plate by friendly road signs—but the bridge itself is curiously bent, warped like a bow as its western anchorage moves north toward San Francisco.

It distorts more and more every day of the month, every year, due to the slow effects of fault creep. Built straight, it is already becoming a graceful curve.

[Image: Looking east at the North American Plate in Parkfield; photos by Geoff Manaugh].

Parkfield is also approximately where fault creep begins in the state, Snyder explained, marking the southern edge of a zone of tectonic mobility that extends up roughly to Hollister and then begins again on a brief stretch of the Hayward Fault in the East Bay.

Indeed, another suggestion of Snyder’s was that I go up to visit a very specific corner in the city of Hayward, where the curb at the intersection of Rose and Prospect Streets has long since been shifted out of alignment.

Over the past decade—most recently, in 2011—someone has actually been drawing little black arrows on the concrete to help visualize how far the city has drifted in that time.

The result is something like an alternative orientation point for the city, a kind of seismic meridian—or perhaps doomsday clock—by which Hayward’s ceaseless cleaving can be measured.

[Images: A moving curb becomes an inadvertent compass for measuring seismic energy in Hayward; photos by Geoff Manaugh].

Attempting to visualize earthquakes on a thousand-year time span, or to imagine the pure abstraction of seismic energy, can be rather daunting; this makes it all the more surprising to realize that even the tiniest details hidden in plain sight, such as cracks in the sidewalk, black sharpie marks on curbs, or lazily tilting front porches, can actually be real-time evidence that California is on the move.

But it is exactly these types of signs that function as minor landmarks for the seismic tourist—and, for all their near-invisibility, visiting them can still provide a mind-altering experience.

Back in Hollister, Snyder warned, many of these already easily missed signs through which fault creep is made visible are becoming more and more hard to find.

The town is rapidly gentrifying, he pointed out, and Hollister’s population is beginning to grow as its quiet and leafy streets fill up with commuters who can no longer afford to live closer to Silicon Valley or the Bay. This means that the city’s residents are now just a bit faster to repair things, just a bit quicker to tear down structurally unsound houses.

One of the most famous examples of fault creep, for example—a twisted and misshapen home formerly leaning every which way at a bend in Locust Avenue—is gone. But whatever replaces it will face the same fate.

After all, the creep is still there, like a poltergeist disfiguring things from below, a malign spirit struggling to make itself visible.

Beneath the painted eaves and the wheels of new BMWs, the landscape is still on the move; the deformation is just well hidden, a denied monstrosity reappearing millimeter by millimeter despite the quick satisfaction of weekend repair jobs. Tumid and unstoppable, there is little that new wallpaper or re-poured driveways can do to disguise it.

[Image: Haphazard concrete patchwork in a formerly straight sidewalk betrays the slow action of fault creep; photo by Geoff Manaugh].

Snyder remembered one more site in Hollister that he urged me to visit on my way out of town.

In the very center of Hollister’s Dunne Park, a nice and gentle swale “like a chaise longue,” in his words, has been developing.

Expecting to find just a small bump running through the park, I was instead surprised to see that there is actually a rather large grassy knoll forming there, a rolling and bucolic hill that few people would otherwise realize is an active tectonic fault.

[Image: A fault-caused grassy knoll rises in the center of Dunne Park in Hollister; photo by Geoff Manaugh].

In fact, he said, residents have been entirely unperturbed by this mysterious appearance of a brand new landform in the middle of their city, seeing it instead as an opportunity for better sunbathing. Fault creep is not without its benefits, he joked.

Snyder laughed as he described the sight of a dozen people and their beach towels, all angling themselves upward toward the sun, getting tan in a mobile city with the help of plate tectonics.

[Note: An earlier version of this piece was first published on The Daily Beast (where I did not choose the original headline). I owe a huge thanks to Andy Snyder for the phone conversation in which we discussed fault creep; and the book Finding Fault in California: An Earthquake Tourist’s Guide by Susan Elizabeth Hough was also extremely useful. Finally, please also note that, if you do go to Hollister or Hayward to photograph these sites, be mindful of the people who actually live there, as they do not necessarily want crowds of strangers gathering outside their homes].

Immaculate Ecologies

[Image: Via the Midway Atoll National Wildlife Refuge].

“We will put up the mountains. We will lay out the prairie. We will cut rivers to join the lakes.” So says the narrator of a nice piece of ecosystem fiction by my friend Scott Geiger published over at Nautilus.

This corporate spokesperson is building virgin terrain: “all-new country, elevated and secured from downstairs, with a growing complement of landforms, clean waters, ecologies, wilderness.”

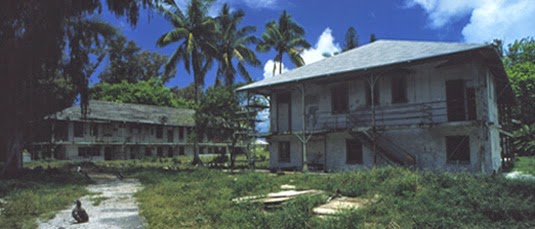
I was reminded of Geiger’s work when I came across an old bookmark here on my computer, with a story that reads like something straight out of the golden age of science fiction: a corporate conglomerate, intent on spanning vast gulfs of space, finds itself engineering an entire ecosystem into existence on a remote stopping-off point, turning bare rocks into an oasis, in order to ensure that its empire can expand.

This could be the premise of a Hugo Award-winning interplanetary space opera—or it could be the real-life history of the Commercial Pacific Cable Company.

[Image: Via the Midway Atoll National Wildlife Refuge].

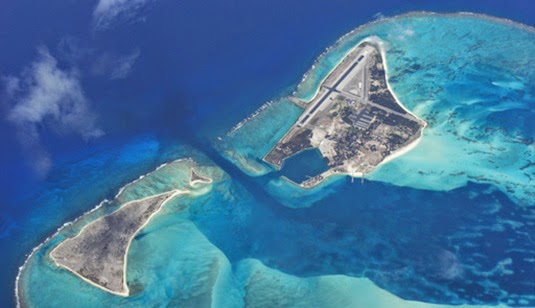
The Company was the first to lay a direct submarine cable from the United States to East Asia, but this required the use of a remote atoll, 1,300 miles northwest of Honolulu, called Midway, not yet famous for its role in World War II.

At the time, however, there was barely anything more there than “low, sandy island[s] with little vegetation,” considered by the firm’s operations manager to be “unfit for human habitation.” The tiny islands—some stretches no more than sandbars—would have been impossible to use, let alone to settle.

Like Geiger’s plucky terraforming super-company, putting up the mountains and laying out the prairie, the Cable Company and its island operations manager “initiated the long process of introducing hundreds of new species of flora and fauna to Midway.”

During this period, the superintendent imported soil from Honolulu and Guam to make a fresh vegetable garden and decorate the grounds. By 1921, approximately 9,000 tons of imported soil changed the sandy landscape forever. Today, the last living descendants of the Cable Company’s legacy still flutter about: their pet canaries. The cycad palm, Norfolk Island Pine, ironwood, coconut, the deciduous trees, everything seen around the cable compound is alien. Since Midway lacked both trees and herbivorous animals, the ironwood trees spread unchecked throughout the Atoll. What else came in with the soil? Ants, cockroaches, termites, centipedes; millions of insects which never could have made the journey on their own.

Strangely, the evolved remnants of this corporate ecosystem are now an international bird refuge, as if saving space for the feral pets of long-dead submarine cable operators.

[Image: Via the Midway Atoll National Wildlife Refuge].

The preserved ruins of old Cable Company buildings stand amidst the trees, surely now home to many of those “millions of insects which never could have made the journey on their own.” Indeed, “the four main Cable Company buildings, constructed of steel beams and concrete with twelve-inch thick first-story walls, have fought a tough battle with termites, corrosion, and shifting sands for nearly a century.”

It is a built environment even down to the biological scale—a kind of time-release landscape now firmly established and legally protected.

It’s worth pointing out, however, that the constructed frontier lands of Scott Geiger’s fictions and the national park of curated species still fluttering their wings at Midway share much with the even stranger story of terraforming performed by none other than Charles Darwin on Ascension Island.

This is, in the BBC’s words, “the amazing story of how the architect of evolution, Kew Gardens and the Royal Navy conspired to build a fully functioning, but totally artificial ecosystem.” It’s worth quoting at length:

Ascension was an arid island, buffeted by dry trade winds from southern Africa. Devoid of trees at the time of Darwin and [his friend, the botanist Joseph] Hooker’s visits, the little rain that did fall quickly evaporated away.

Egged on by Darwin, in 1847 Hooker advised the Royal Navy to set in motion an elaborate plan. With the help of Kew Gardens—where Hooker’s father was director—shipments of trees were to be sent to Ascension.

The idea was breathtakingly simple. Trees would capture more rain, reduce evaporation and create rich, loamy soils. The “cinder” would become a garden.

So, beginning in 1850 and continuing year after year, ships started to come. Each deposited a motley assortment of plants from botanical gardens in Europe, South Africa and Argentina.

Soon, on the highest peak at 859m (2,817ft), great changes were afoot. By the late 1870s, eucalyptus, Norfolk Island pine, bamboo, and banana had all run riot.

It’s not a wilderness forest, then, but a feral garden “run riot” on the slopes of a remote, militarized island outpost (one photographed, I should add, by photographer Simon Norfolk, as discussed in this earlier interview on BLDGBLOG).

[Image: The introduced forestry of Ascension Island, via Google Maps].

In a sense, Ascension’s fog-capturing forests are like the “destiny trees” from Scott Geiger’s story in Nautilus—where “there are trees now that allow you to select pretty much what form you want ten, fifteen, twenty years down the road”—only these are entire destiny landscapes, pieced together for their useful climatic side-effects.

For anyone who happened to catch my lecture at Penn this past March, the story of Ascension bears at least casual comparison to the research of Christine Hastorf at UC Berkeley. Hastorf has written about the “feral gardens” of the Maya, or abandoned landscapes once deeply cultivated but now shaggy and overgrown, all but indistinguishable from nature. For Hastorf, many of the environments we currently think of as Central American rain forest are, in fact, a kind of indirect landscape architecture, a terrain planted and pruned long ago and thus not wilderness at all.

Awesomely, the alien qualities of this cloud forest can be detected. As one ecologist remarked to the BBC after visiting the island, “I remember thinking, this is really weird… There were all kinds of plants that don’t belong together in nature, growing side by side. I only later found out about Darwin, Hooker and everything that had happened.” It was like stumbling upon a glitch in the matrix.

In the case of these islands, I love the fact that historically real human behavior competes, on every level, for sheer outlandishness with the best of science fiction for its creation of entire ecosystems in remote, otherwise inhospitable environments; advanced landscaping has become indistinguishable from planetology. And, in Scott Geiger’s case, I love the fact that the perceived weirdness of his story comes simply from the scale at which he describes these landscape activities being performed.

In other words, Geiger is describing something that actually happens all the time; we just refer to it as the suburbs, or even simply as landscaping, a near-ubiquitous spatial practice that is no less other-worldly for taking place one half-acre at a time.

[Image: A suburban landscape being rolled out into the forest like carpet; photo by BLDGBLOG].

Soon, even the discordant squares of grass seen in the above photograph will seem as if they’ve always been there: a terrain-like skin graft thriving under unlikely circumstances.

Think of a short piece in New Scientist earlier this year: “All this is forcing enthusiasts to reconsider what ‘nature’ really is. In many places, true wilderness vanished thousands of years ago, and the landscapes we think of as natural are largely artificial.”

Indeed, like something straight out of a Geiger short story, “thousands of years from now our descendants may think of African lions roaming American plains as ‘natural’ too.”

Through the Cracks Between Stars

[Image: Trevor Paglen, “PAN (Unknown; USA-207),” from The Other Night Sky].

I had the pleasure last winter of attending a lecture by Trevor Paglen in Amsterdam, where he spoke about a project of his called The Last Pictures. As Paglen describes it, “Humanity’s longest lasting remnants are found among the stars.”

Over the last fifty years, hundreds of satellites have been launched into geosynchronous orbits, forming a ring of machines 36,000 kilometers from earth. Thousands of times further away than most other satellites, geostationary spacecraft remain locked as man-made moons in perpetual orbit long after their operational lifetimes. Geosynchronous spacecraft will be among civilization’s most enduring remnants, quietly circling earth until the earth is no more.

Paglen ended his lecture with an amazing anecdote worth repeating here. Expanding on this notion—that humanity’s longest-lasting ruins will not be cities, cathedrals, or even mines, but rather geostationary satellites orbiting the Earth, surviving for literally billions of years beyond anything we might build on the planet’s surface—Paglen tried to conjure up what this could look like for other species in the far future.

Billions of years from now, he began to narrate, long after city lights and the humans who made them have disappeared from the Earth, other intelligent species might eventually begin to see traces of humanity’s long-since erased presence on the planet.

Consider deep-sea squid, Paglen suggested, who would have billions of years to continue developing and perfecting their incredible eyesight, a sensory skill perfect for peering through the otherwise impenetrable darkness of the oceans—yet also an eyesight that could let them gaze out at the stars in deep space.

Perhaps, Paglen speculated, these future deep-sea squid with their extraordinary powers of sight honed precisely for focusing on tiny points of light in the darkness might drift up to the surface of the ocean on calm nights to look upward at the stars, viewing a scene that will have rearranged into whole new constellations since the last time humans walked the Earth.

And, there, the squid might notice something.

High above, seeming to move against the tides of distant planets and stars, would be tiny reflective points that never stray from their locations. They are there every night; they are more eternal than even the largest and most impressive constellations in the sky sliding nightly around them.

Seeming to look back at the squid like the eyes of patient gods, permanent and unchanging in these places reserved for them there in the firmament, those points would be nothing other than the geostationary satellites Paglen made reference to.

This would be the only real evidence, he suggested, to any terrestrial lifeforms in the distant future that humans had ever existed: strange ruins stuck there in the night, passively reflecting the sun, never falling, angelic and undisturbed, peering back through the veil of stars.

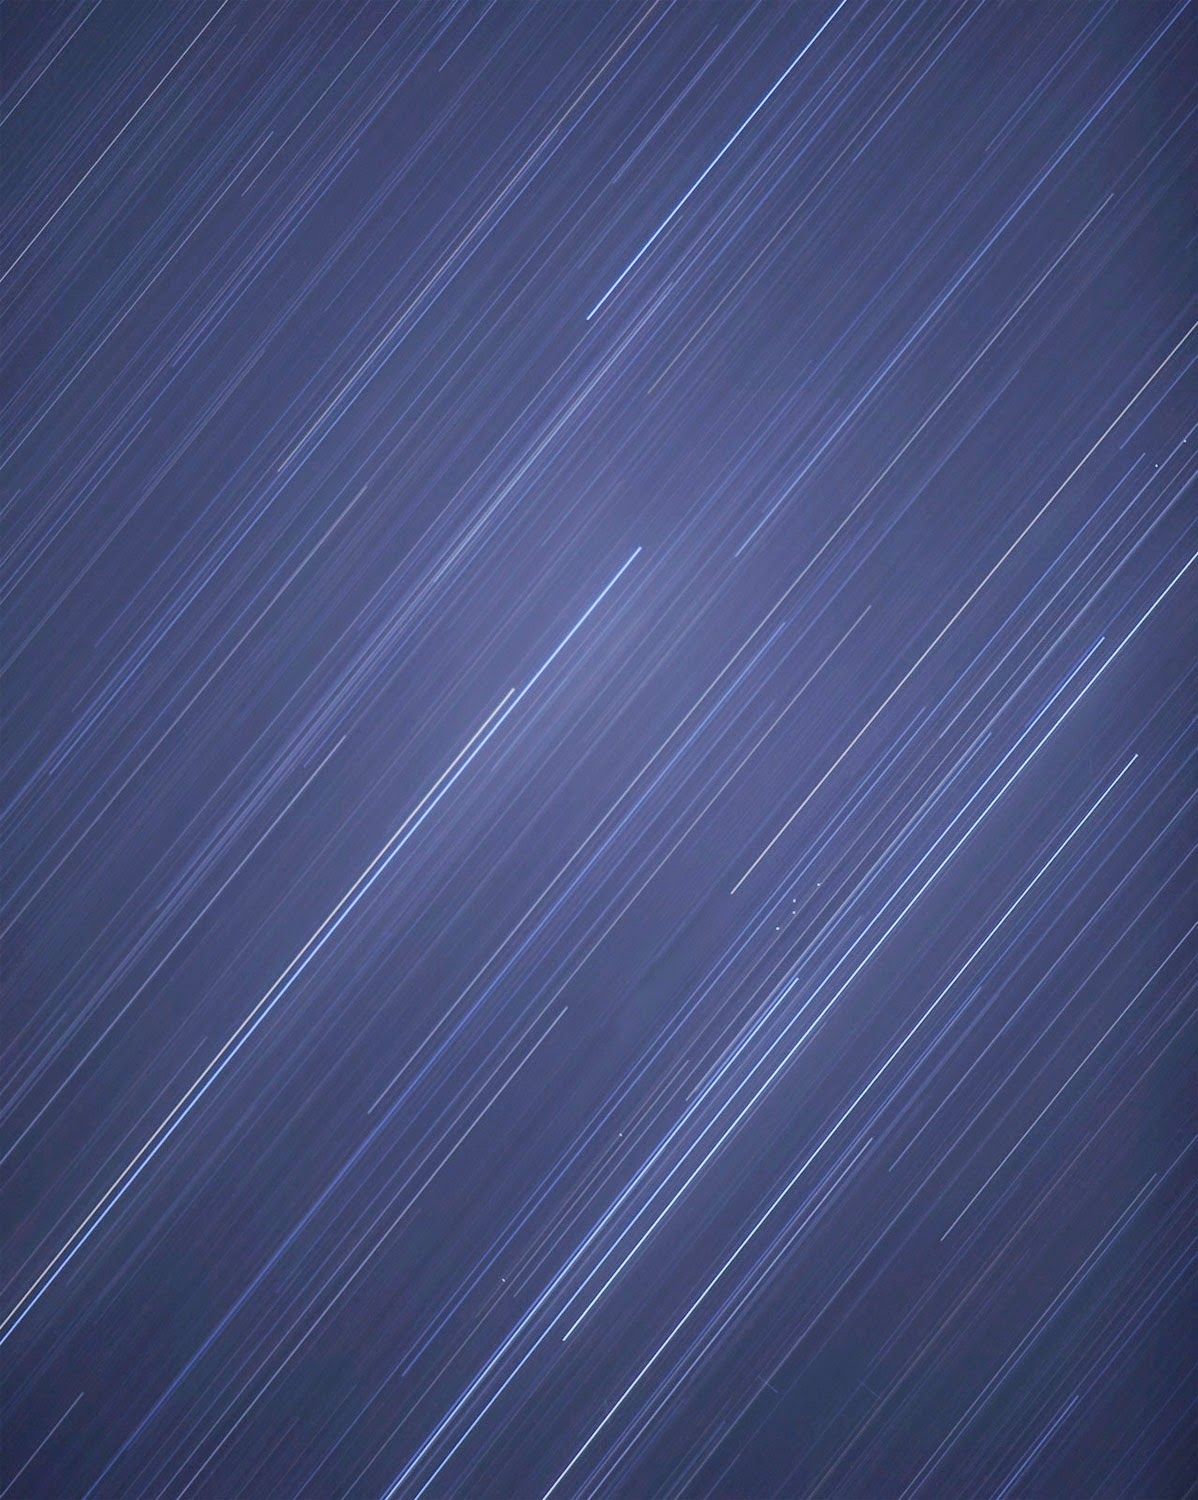
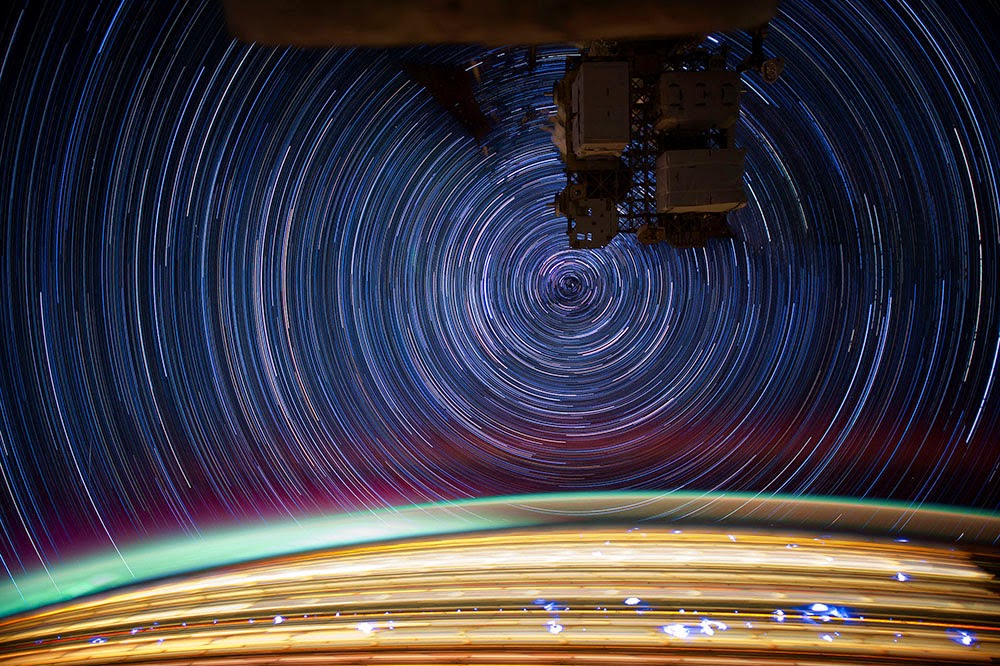
[Image: Star trails, seen from space, via Wikimedia].

Aside from the awesome, Lovecraftian poetry of this image—of tentacular creatures emerging from the benthic deep to gaze upward with eyes the size of automobiles at satellites far older than even continents and mountain ranges—the actual moment of seeing these machines for ourselves is equally shocking.

By now, for example, we have all seen so-called “star trail” photos, where the Earth’s rotation stretches every point of starlight into long, perfect curves through the night sky. These are gorgeous, if somewhat clichéd, images, and they tend to evoke an almost psychedelic state of cosmic wonder, very nearly the opposite of anything sinister or disturbing.

[Image: More star trails from space, via Wikipedia].

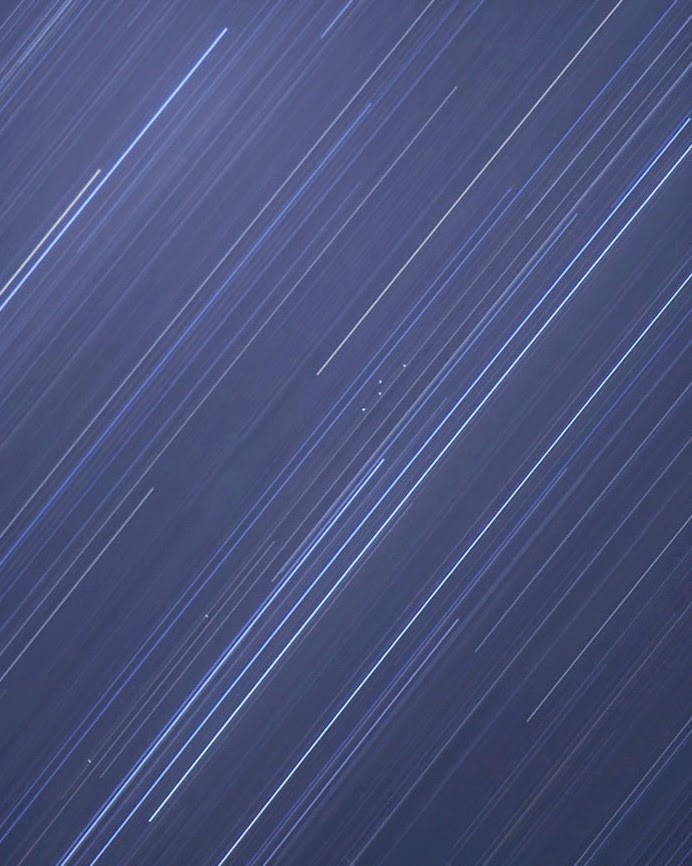
Yet in Paglen’s photo “PAN (Unknown; USA-207)”—part of another project of his called The Other Night Sky— something incredible and haunting occurs.

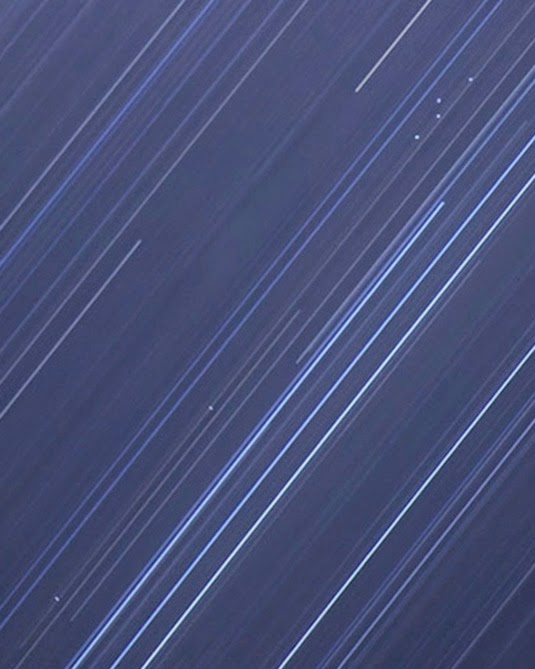
Amidst all those moving stars blurred across the sky like ribbons, tiny points of reflected light burn through—and they are not moving at all. There is something else up there, this image makes clear, something utterly, unnaturally still, something frozen there amidst the whirl of space, looking back down at us as if through cracks between the stars.

[Image: Cropping in to highlight the geostationary satellites—the unblurred dots between the star trails—in “PAN (Unknown; USA-207)” by Trevor Paglen, from The Other Night Sky].

The Other Night Sky, Paglen explains, “is a project to track and photograph classified American satellites, space debris, and other obscure objects in Earth orbit.”

To do so, he uses “observational data produced by an international network of amateur satellite observers to calculate the position and timing of overhead transits which are photographed with telescopes and large-format cameras and other imaging devices.”

The image that opens this post “depicts an array of spacecraft in geostationary orbit at 34.5 degrees east, a position over central Kenya. In the lower right of the image is a cluster of four spacecraft. The second from the left is known as ‘PAN.'”

What is PAN? Well, the interesting thing is that not many people actually know. Its initials stand for “Palladium At Night,” but “this is one mysterious bird,” satellite watchers have claimed; it is a “mystery satellite” with “an unusual history of frequent relocations,” although it is to be found in the eastern hemisphere, stationed far above the Indian Ocean (Paglen took this photograph from South Africa).

As Paglen writes, “PAN is unique among classified American satellites because it is not publically claimed by any intelligence of military agency. Space analysts have speculated that PAN may be operated by the Central Intelligence Agency.” Paglen and others have speculated about other possible meanings of the name PAN—check out his website for more on that—but what strikes me here is less the political backstory behind the satellites than the visceral effect such an otherwise abstract photograph can have.

In other words, we don’t actually need Paglen’s deep-sea squid of the far future with their extraordinary eyesight to make the point for us that there are now uncanny constellations around the earth, sinister patterns visible against the backdrop of natural motion that weaves the sky into such an inspiring sight.

These fixed points peer back at us through the cracks, an unnatural astronomy installed there in secret by someone or something capable of resisting the normal movements of the universe, never announcing themselves while watching anonymously from space.

[Image: Cropping further into “PAN (Unknown; USA-207)” by Trevor Paglen, from The Other Night Sky].

For more on Trevor Paglen’s work, including both The Last Pictures and The Other Night Sky, check out his website.

Architecture-by-Bee and Other Animal Printheads

[Image: By John Becker].

For thousands of years, animal bodies have been used as living 3D printers—or sentient printheads, we might say—but the range of possible material outputs is set to change quite radically. In fact, bioengineering is rapidly making this idea—that spiders, silkworms, and honeybees, to name just a few, are already 3D printers—more than just a poetic metaphor.

Those creatures are organic examples of depositional manufacturing, and they have been domesticated and used throughout human history for specific creative ends, whether it’s to produce something as mundane as honey or silk, or something far more outlandish, including automotive plastics, military armaments, and even concrete, as we’ll see below.

Animal Printheads

Researchers in Singapore discovered several years ago, for example, that silkworms fed a chemically peculiar diet could produce colored silk, readymade for use in textiles, as if they are actually biological ink cartridges; and other examples—in which animal bodies have been temporarily tweaked or even specifically bred to produce new, economically useful materials on a semi-industrial scale—are not hard to come by.

As it happens, for example, using bees as 3D printers is quickly becoming something of an accepted artistic process and its deep incorporation into advanced manufacturing processes will not be far behind.

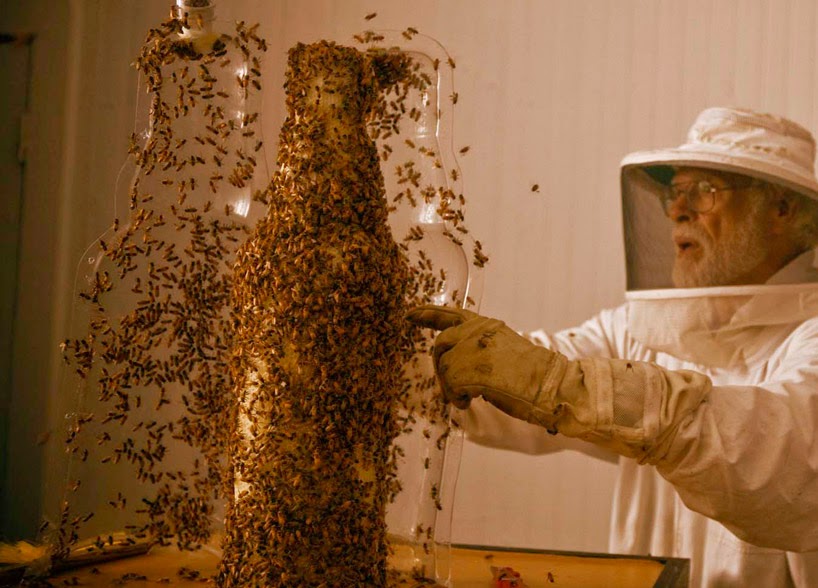
Perhaps the most widely seen recent exploration of the animal-as-3D-printer concept was done last year for, of all things, a publicity stunt by Dewar’s, in which the company “3D printed” a bottle of Dewar’s using nothing but specially shaped and cultivated beehives.

[Images: Courtesy of Dewar’s, via designboom].

These pictures tell the story clearly enough: using a large glass bottle as a mold in which the bees could create new hives, the process then ended with the removal of the glass and the revealing of a complete, bottle-shaped, “3D-printed” hive.

As Dewar’s joked, it was 3B-printed.

[Images: Courtesy of Dewar’s, via designboom].

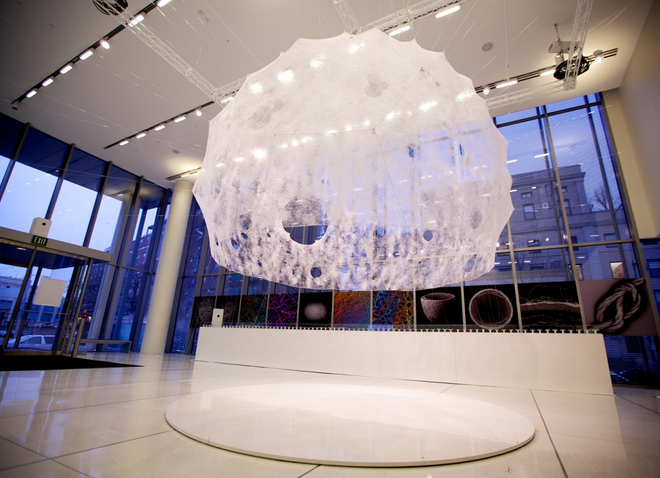
Or take the Silk Pavilion, another recent project you’ve undoubtedly already seen, in which researchers at MIT, led by architect Neri Oxman, 3D-printed a room-sized dome using carefully guided silkworms as living printheads.

[Image: Courtesy of MIT].

The Silk Pavilion was an architectural experiment in which the body of the silkworm, guided along a series of very specific paths, was “deployed as a biological printer in the creation of a secondary structure.”

The primary structure, meanwhile—the pattern used by the silkworms as a kind of depositional substrate—was nothing more than a continuous thread wrapped around a metal scaffold like a labyrinth, seen in the image below.

[Image: Courtesy of MIT].

It was at this point in the process that a “swarm of 6,500 silkworms was positioned at the bottom rim of the scaffold spinning flat non-woven silk patches as they locally reinforced the gaps across CNC-deposited silk fibers.” In other words, they infested the labyrinth and laid down architecture with their passing.

[Image: Courtesy of MIT].

The “CNSilk” method, as it was known, resulted in a gossamer, woven dome that looks more like a cloud than a building.

[Images: Courtesy of MIT].

What both of these examples demonstrate—despite the fact that one is a somewhat tongue-in-cheek media ploy by an alcohol company—is that animal bodies can, in fact, be guided, disciplined, or otherwise regulated to produce large-scale structures, from consumer objects to whole buildings.

After all, the very origins of architecture were a collaboration with animal bodies, and experiments like these only update those earliest constructions.

In both cases, however, the animals are simply depositing, or “printing,” what they would normally (that is, naturally, in the absence of human augmentation) produce: silk and honey. Things get substantially more interesting, on the other hand, when we look at more exotic biological materials.

Bee Plastic

For half a decade or more, materials scientist Debbie Chachra at New England’s Olin College of Engineering has been researching what’s known as “bee plastic”: a cellophane-like biopolymer produced by a species native to New England, called Colletes inaequalis.

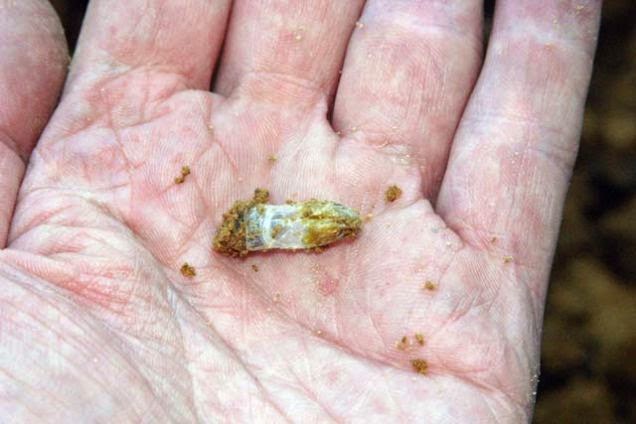
These bees secrete tiny, cocoon-like structures in the soil—one such structure can be seen in the photo, below—using a special gland unique to its species. The resulting, non-fossil-fuel-based natural polyester not only resists biodegradation, it also survives the temperate extremes of New England, from the region’s sweltering summers to its subzero winter storms.

[Image: Courtesy of Deb Chachra].

More intriguingly, however, the cellophane-like bee plastic “doesn’t come from petroleum,” Chachra explained to me for a 2011 end-of-year article in Wired UK. “The bees are pretty much just eating pollen and producing this plastic,” she continued, “and we’re trying to understand how they do it.”

Bee plastic, Chachra justifiably speculates, could perhaps someday be used to manufacture everything from office supplies to car bumpers, acting as an oil-free alternative to the plastics we use today. In the process, it could perhaps even kickstart a homegrown bio-industry for New England, where the species already thrives, wherein the very idea of a factory needs to be fundamentally reimagined.

The most exciting architectural possibilities here come less from the bees themselves and more from the elaborate structures that would be required to house their activities; imagine a brand new BMW factory somewhere in the suburbs of Boston populated only by plastic-producing bees, and you get some sense of where industrial manufacturing might go in an alternate future. Not unlike Dewar’s bee-printed bottle, then, augmented cousins of Chachra’s plastic-producing bees could thus 3D-print whole car bodies, kitchen counters, architectural parts, and other everyday products.

But even this, of course, is a vision of animal-based manufacturing that relies on the already-existent excretions of living creatures. Could we—temporarily putting aside the ethical implications of this, simply to discuss the material possibilities—perhaps genetically modify bees, silkworms, spiders, and so on to produce substantially more robust biopolymers, something not just strong enough to resist biodegrading but that could be produced and used on an industrial scale?

Recall, for example, that the U.S Army, working with a Canadian firm called Nexia Biotechnologies, was successful in its attempt to genetically engineer a goat that would produce spider-silk proteins in its milk. Incredibly, those “Biosteel goats,” as they were later known, were eventually housed in old ammunition bunkers on a New York State military base, as if they were living bioweapons that needed to be held in quarantine.

[Image: Biosteel goats summed-up in one simple equation (via)].

The ultimate goal of producing these goats was to generate an unbreakable super-fiber that could be used in battle gear, including “lightweight body armor made of artificial spider silk,” and other military armaments; but others have speculated that entire bridges or other pieces of urban infrastructure could someday be woven by goats.

These possibilities become even more strange and promising when we move to materials like concrete.

Concrete Honey

As part of an ongoing collaborative project, NYC-based designer John Becker and I have been looking at the possibility of using bees that have been genetically modified to print concrete. We could call them architectural printheads.

[Image: By John Becker].

Initially inspired by a somewhat willful misreading of a project published under the title “Bees Make Concrete Honey,” John and I began to imagine and illustrate a series of science-fictional scenarios in which a new urban bee species, called Apis caementicium—or cement bees—could be deployed throughout the city as a low-cost way to repair statues and fix architectural ornament, even to produce whole, free-standing structures, such as cathedrals.

[Image: By John Becker].

In a process not unlike that used for the Dewar’s bottle, above, the bees would be given an initial form to work within. Then, buzzing away inside this mold or cast, and additively depositing the ingredients for bio-concrete on the walls, frames, or structures they’ve been attached to, the bees could 3D-print new architectural forms into existence.

This includes, for example, the iconic stone lions found outside the New York Public Library; they’ve been damaged by exposure and human contact, but can now be fixed from within by concrete bees. Think this as a kind of organic caulking.

[Image: By John Becker].

Yet tidy plots such as these invariably spin out of control and things don’t quite go as planned.

Feral Printers

Predictably, these concrete bees eventually escape: first just a few here and there, but then an upstart colony takes hold elsewhere in the city. They breed, speciate, and expand.

Within a few years, as the bees reproduce and thrive, and as their increasingly far-flung colonies grow, people become aware of the scale of the problem: rogue 3D-printing bees have begun to infest the region.

[Image: By John Becker].

They print where they shouldn’t print and, without the direction of their carefully made formwork and molds, what they produce often makes no sense.

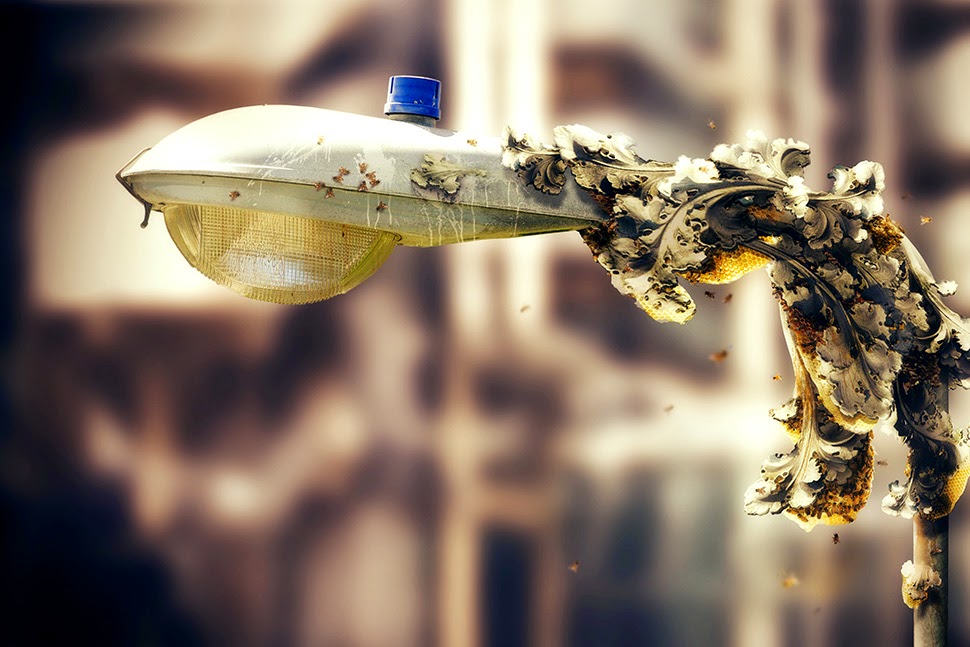
They print on signs and phone poles; they take over parks and gardens where they print strange forms on flowers, sealing orchids and roses in masonry shells. Bizarre gardens of hardened geometry form on windowsills and ledges, deep in urban forests and along railways and roads.

[Image: By John Becker].

Tiny fragments of concrete can soon be seen atop plants and door frames, beneath cars and on chain-link fences, coiling up and consuming the sides of structures where they were never meant to be, like kudzu; and, of course, strange bee bodies are found now and again, these little concrete-laden corpses lying in the deep grass of backyards, on parking lots and rooftops.

[Image: By John Becker].

Their fallen bodies, augmented and extraordinary, thus dot the very city they’ve also beautified and improved—this place where they once printed church steeples and apartment ornament, where they fixed cracked statues, sidewalks, and walls.

Of course, other, more adventurous or simply disoriented bees make their way further, hitching inadvertent rides in the holds of planes and cargo ships, mistakenly joining other hives then shipped around the world.

The bees are soon found in Europe, China, and—for reasons never quite clear to materials scientists—throughout India, where, as in the sample image below, they can be seen adding unnecessary ornamentation to temples in Rajasthan. Swarming and uncountable, they busily speck the outside of the building with bulbous and tumid additions no architect would ever have planned.

[Image: By John Becker].

As the bees speciate yet further, and their concrete itself begins to mutate—in some cases, so hard it can only be removed by the toughest drills and demolition equipment, other times more like a slow-drying sandstone incapable of achieving any structure at all—this experiment in animal printheads, these living 3D printers producing architecture and industrial objects, comes to end.

A Bee Amidst The Machines

Most designers learn from the—in retrospect—obvious mistakes that led to these feral printers, returning to more easily controlled inorganic factories and industrial processes. But, even then, on quiet spring days, a tiny buzzing sound can occasionally be heard beneath someone’s front porch, out in the suburban gardens somewhere, deep inside National Parks, and even inside huge machines, where whole automobile assembly lines come shuddering to a halt.

There, within the gears, just doing what it’s used to doing—what we made it do—a tiny family of 3D-printing bees has taken root, leaving errant clumps of concrete wherever they alight.

(Thanks to John Becker for the fun. An earlier version of this post was previously published on Gizmodo).

Welcome to the World of the Plastic Beach

[Image: The new plastic geology, photographed by Patricia Corcoran, via Science].

Incredibly, a “new type of rock cobbled together from plastic, volcanic rock, beach sand, seashells, and corals has begun forming on the shores of Hawaii,” Science reports.

This new rock type, referred to as a “plastiglomerate,” requires a significant heat-source in order to form, as plastiglomerates are, in effect, nothing but molten lumps of plastic mixed-in with ambient detritus. Hawaii with its coastal and marine volcanoes, offers a near-perfect formational landscape for this artificially inflected geology to emerge—however, Patricia Corcoran, one of the discoverers of these uncanny rocks, thinks we’ll likely find them “on coastlines across the world. Plastiglomerate is likely well distributed, it’s just never been noticed before now, she says.”

We’ve been surrounded by artificial geologies all along.

But is it really geology? Or is it just melted plastic messily assembled with local minerals? Well, it’s both, it seems, provided you look at it on different time-scales. After heavier chunks of plastiglomerate form, fusing with “denser materials, like rock and coral,” Science writes, “it sinks to the sea floor, and the chances it will become buried and preserved in the geologic record increase.” It can even form whole veins streaking through other rock deposits: “When the plastic melts, it cements rock fragments, sand, and shell debris together, or the plastic can flow into larger rocks and fill in cracks and bubbles,” we read.

It doesn’t seem like much of a stretch to suggest that our landfills are also acting like geologic ovens: baking huge deposits of plastiglomerate into existence, as the deep heat (and occasional fires) found inside landfills catalyzes the formation of this new rock type. Could deep excavations into the landfills of an earlier, pre-recycling era reveal whole boulders of this stuff? Perhaps.

The article goes on to refer to the work of geologist Jan Zalasiewicz, which is exactly where I would have taken this, as well. Zalasiewicz has written in great detail and very convincingly about the future possible fossilization of our industrial artifacts and the artificial materials that make them—including plastic itself, which, he suggests, might very well leave traces similar to those of fossilized leaves and skeletons.

In a great essay I had the pleasure of including in the recent book Landscape Futures, Zalasiewicz writes: “Plastics, which are made of long chains of subunits, might behave like some of the long-chain organic molecules in fossil plant twigs and branches, or the collagen in the fossilized skeletons of some marine invertebrates. These can be wonderfully well preserved, albeit blackened and carbonized as hydrogen, nitrogen and oxygen are driven off under the effect of subterranean heat and pressure.” Plastiglomerates could thus be seen as something like an intermediary stage in the long-term fossilization of plastic debris, a glimpse of the geology to come.

Ultimately, the idea that the stunning volcanic beaches of Hawaii are, in fact, more like an early version of tomorrow’s semi-plastic continents and tropical archipelagoes is both awesome and ironic: that an island chain known for its spectacular natural beauty would actually reveal the deeply artificial future of our planet in the form of these strange, easily missed objects washing around in the sand and coral of a gorgeous beach.

(Spotted via Rob Holmes. Vaguely related: War Sand).

100 Views of a Drowning World

[Image: Kahn & Selesnick, courtesy Yancey Richardson].

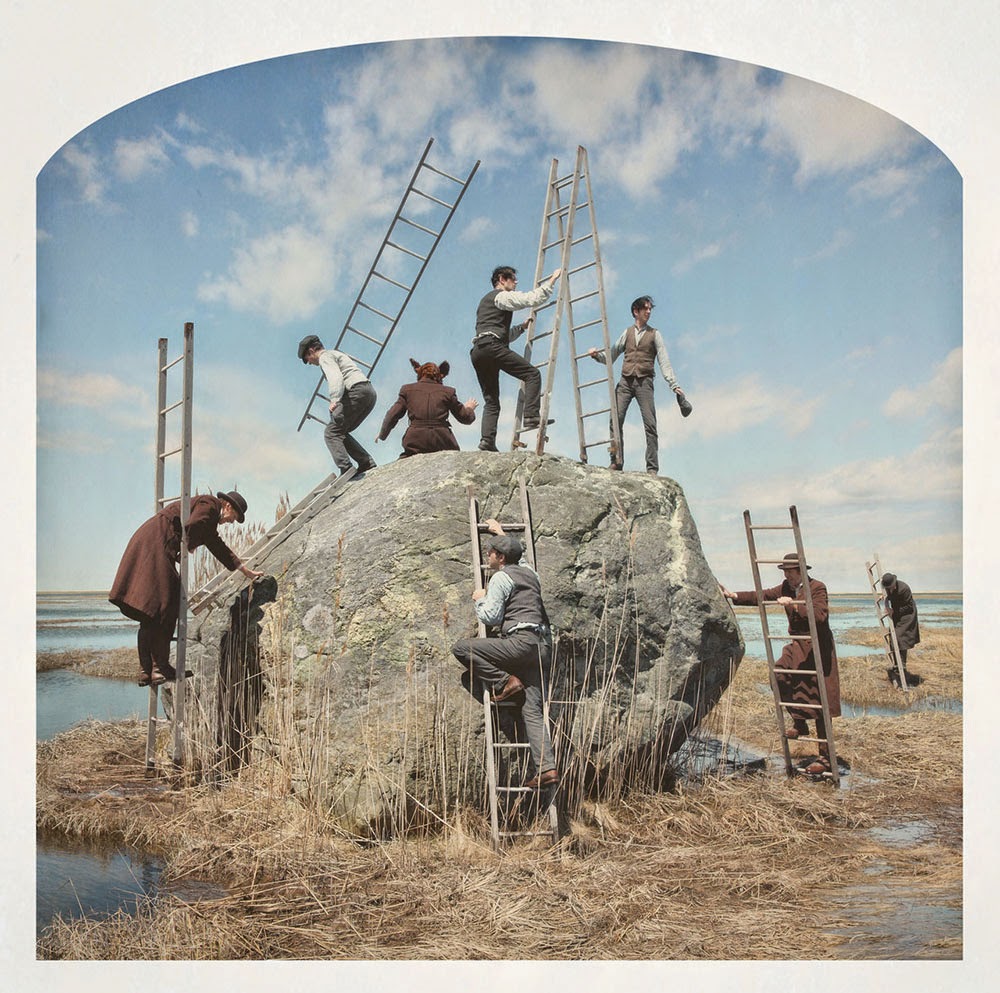
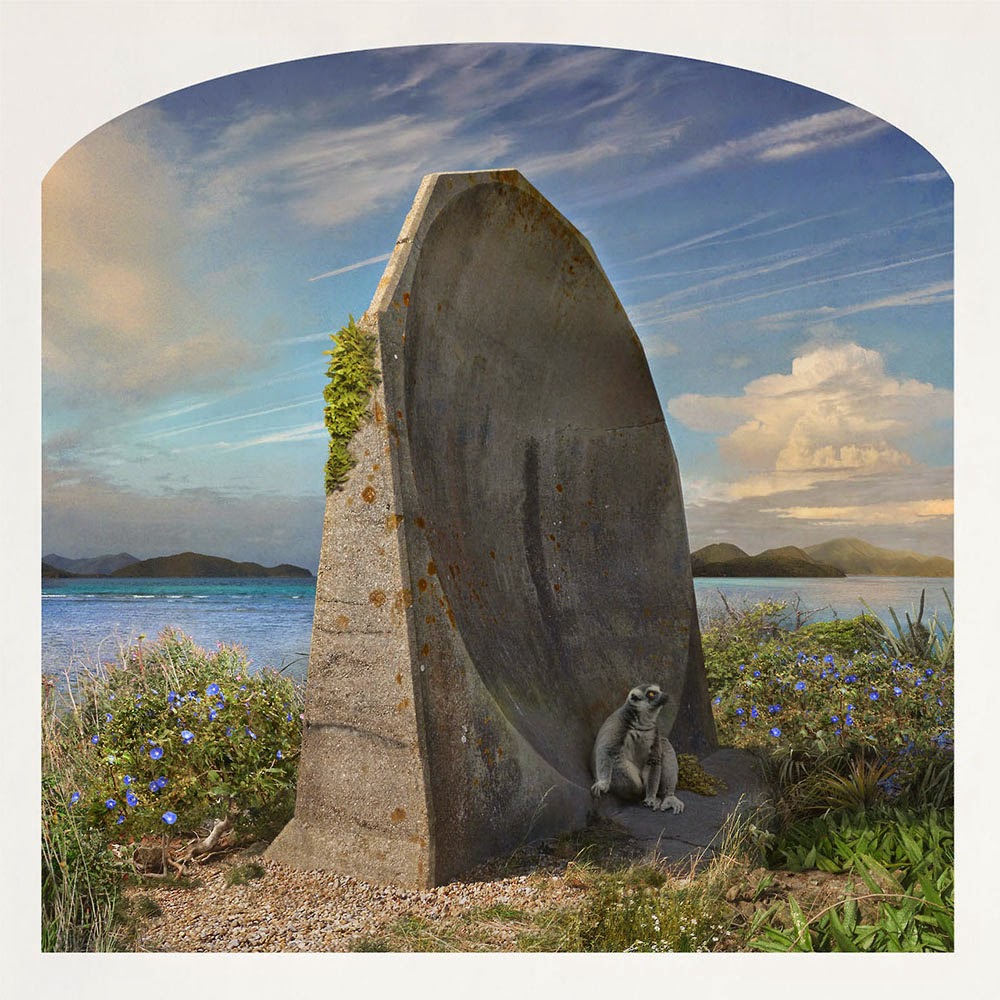
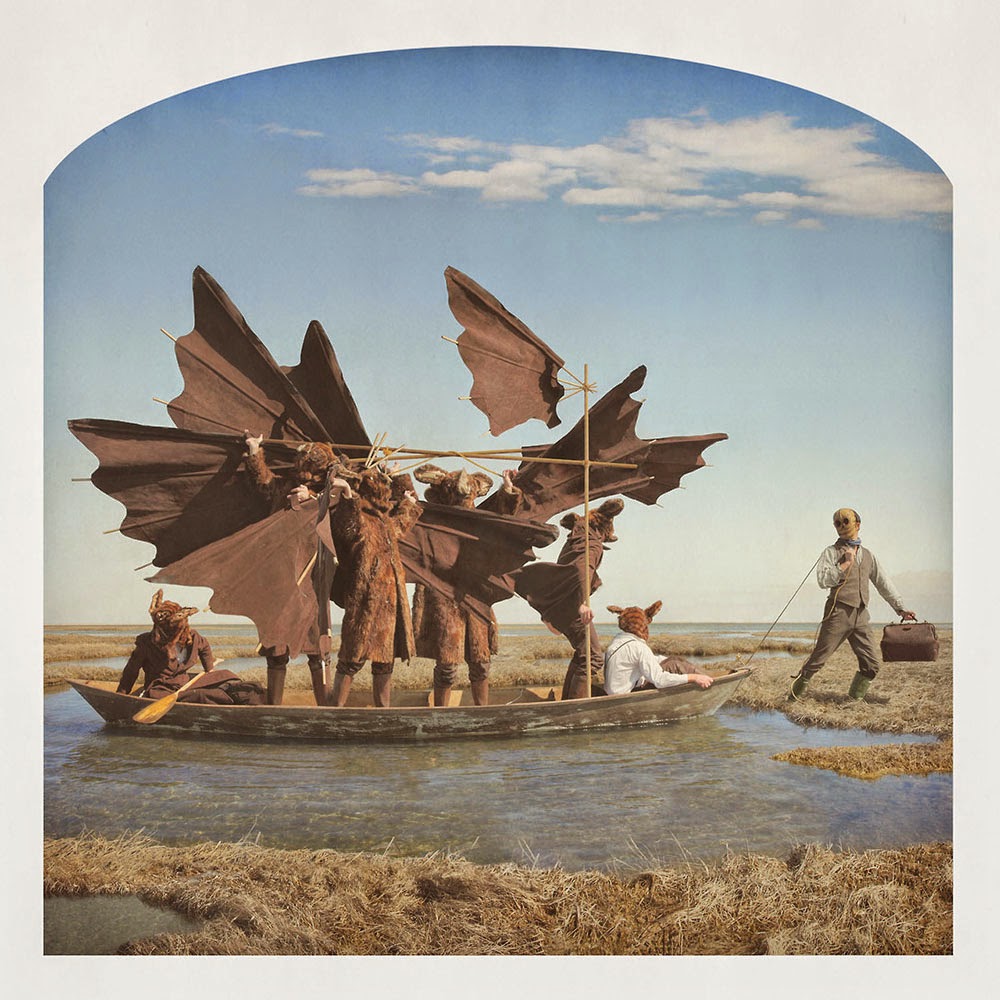
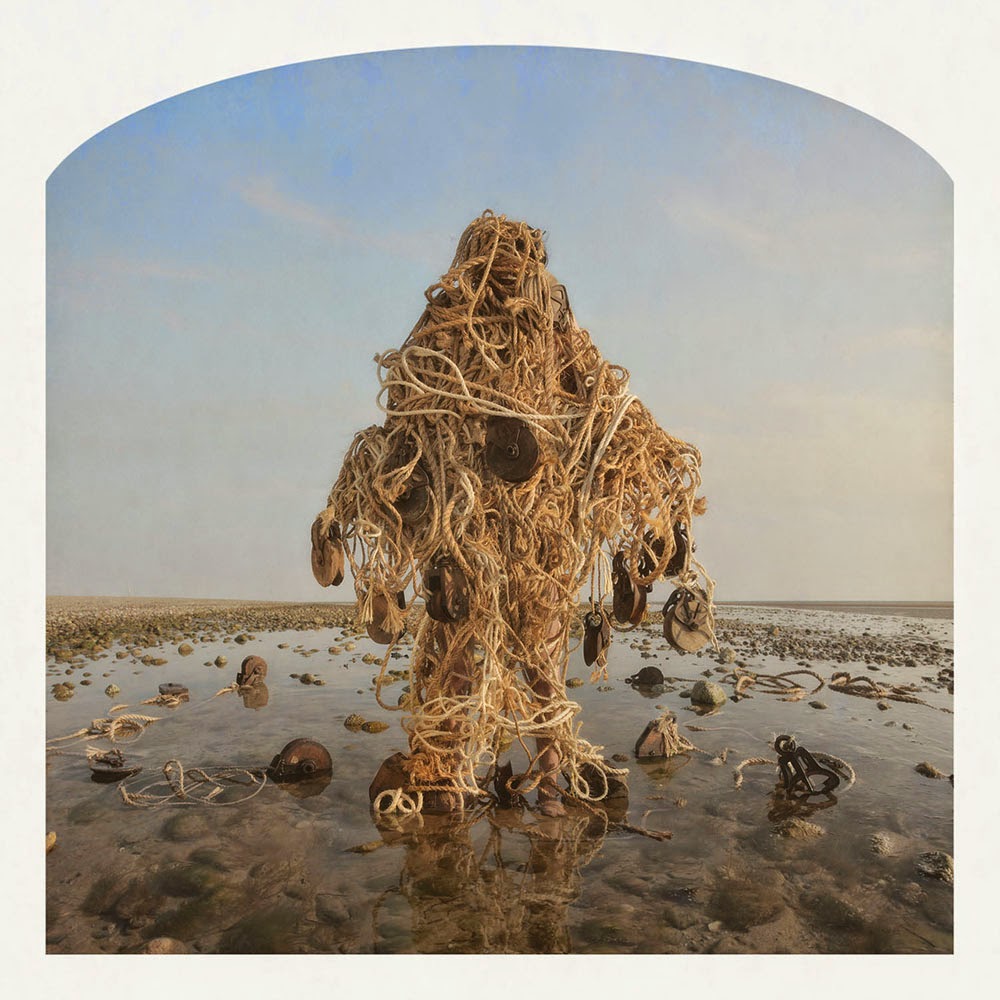
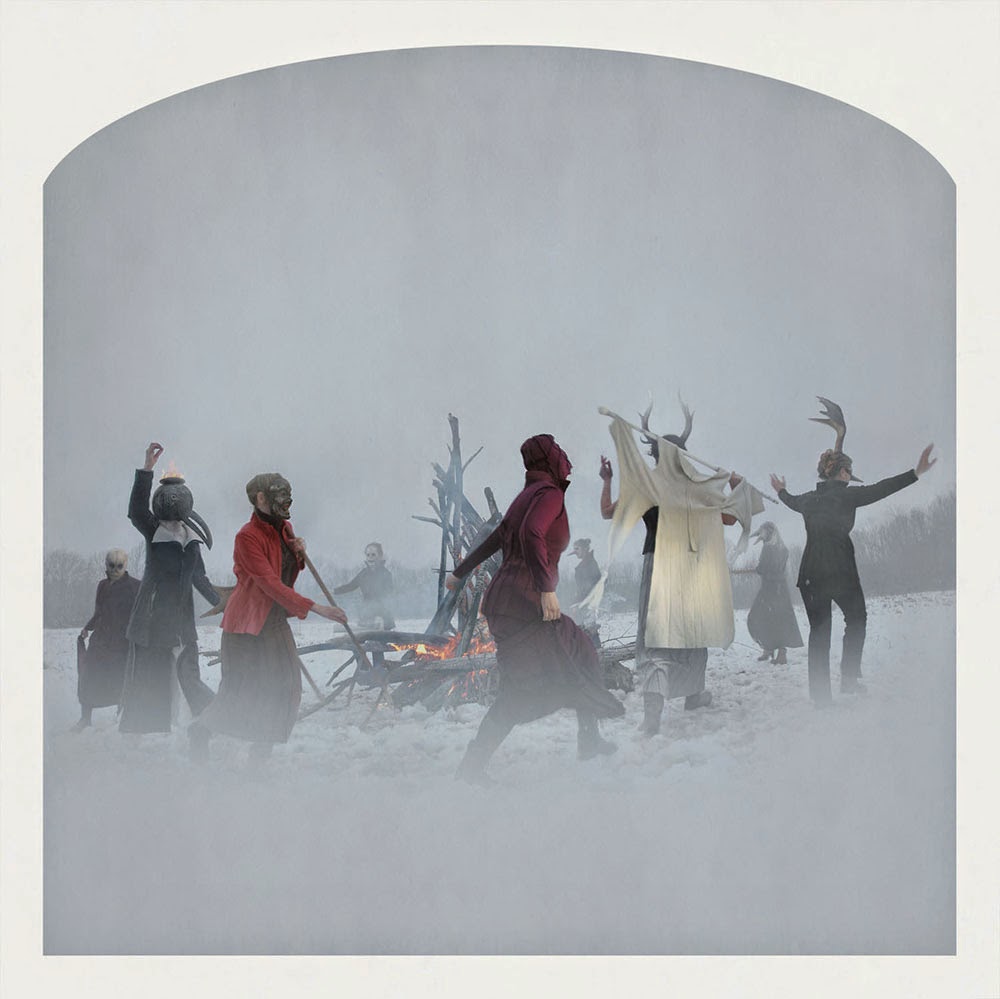
I’ve mentioned the work of artists Kahn & Selesnick before; their surreal narratives are illustrated with elaborately propped photos that fall somewhere between avant-garde theater and landscape fiction, with mountain glaciers, salt mines, alien planets, utopian cityscapes, and, as seen here, the slowly flooding marshes of an unidentified hinterland.

[Image: Kahn & Selesnick, courtesy Yancey Richardson].

These images are from a new project, called Truppe Fledermaus & The Carnival at the End of the World, that opened at New York’s Yancey Richardson gallery last week. “Utilizing photography, drawing, printmaking, sculpture and performance,” the gallery writes, “the artists create robust mythic realities for each project, building imaginary, character-driven fictions from kernels of obscure historical truth.”

Kahn & Selesnick’s latest project follows a fictitious cabaret troupe—Truppe Fledermaus (Bat Troupe)—who travel the countryside staging absurd and inscrutable performances in abandoned landscapes for an audience of no one. The playful but dire message presented by the troupe is of impending ecological disaster, caused by rising waters and a warming planet, the immediate consequences of which include the extinction of the Bat, in this mythology a shamanistic figure representing both nature and humanity. In one sense, the entire cabaret troupe can be seen as a direct reflection of the artists themselves, both entities employing farce and black humor to engage utterly serious concerns.

The particular scenes shown here, all on display until July 3, 2014, are from a sub-series within the project called “100 Views of a Drowning World.”

[Image: Kahn & Selesnick, courtesy Yancey Richardson].

Eccentric residents of a drowning landscape live lives indistinguishable from absurdist stagecraft, as they wander through seemingly wild landscapes that are actually ruins and that will eventually all disappear beneath the deceptively placid tidal flats flowing around them.

[Image: Kahn & Selesnick, courtesy Yancey Richardson].

These anonymous coastal dwellers simulate a nature that is already artificial—a kind of maritime grotesque of overgrown animal forms and humans buried beneath ropes and seaweed—and they set off on doomed expeditions through terrains whose original inhabitants have long been forgotten.

[Image: Kahn & Selesnick, courtesy Yancey Richardson].

Lone figures in boats look out into what will soon be sea, attempting to navigate land as if it is already an ocean.

[Images: Kahn & Selesnick, courtesy Yancey Richardson].

And others attempt to escape into some new strain of Romanticism, witnesses of large-scale terrestrial change who know that this moment on the Earth is rare—though not unique—for the extraordinary transitions that lie over the horizon.

[Image: Kahn & Selesnick, courtesy Yancey Richardson].

In the end, then, the idea is not that these characters’ actions somehow represent or propose a new humanist response to climate change, or that the artists are offering us any sort of practical or ethical insight into what futures might face us in a drowned world, but that these absurd rituals and dreamlike antics instead simply illustrate “a world that is sinking into a marsh.”

It is, as the show’s title suggests, just a carnival at the end of the world.

[Image: Kahn & Selesnick, courtesy Yancey Richardson].

The Yancey Richardson gallery is on W. 22nd Street, over near the High Line; be sure to stop by before July 3. Here is a map and here are more images.

Ghosts of Planets Past: An Interview with Ron Blakey

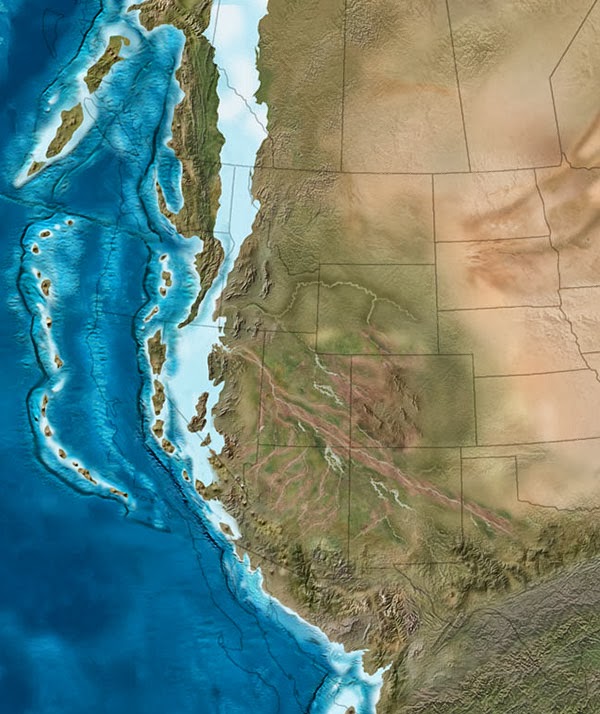
[Image: The west coast of North America as it appeared roughly 215 million years ago; map by Ron Blakey].

The paleo-tectonic maps of retired geologist Ronald Blakey are mesmerizing and impossible to forget once you’ve seen them. Catalogued on his website Colorado Plateau Geosystems, these maps show the world adrift, its landscapes breaking apart and reconnecting again in entirely new forms, where continents are as temporary as the island chains that regularly smash together to create them, on a timescale where even oceans that exist for tens of millions of years can disappear leaving only the subtlest of geological traces.

With a particular emphasis on North America and the U.S. Southwest—where Blakey still lives, in Flagstaff, Arizona—these visually engaging reconstructions of the Earth’s distant past show how dynamic a planet we live on, and imply yet more, unrecognizable changes ahead.

The following images come from Ron Blakey‘s maps of the paleotectonic evolution of North America. The first map shows the land 510 million years ago, progressing from there—reading left to right, top to bottom—through the accretion and dissolution of Pangaea into the most recent Ice Age and, in the final image, North America in its present-day configuration.
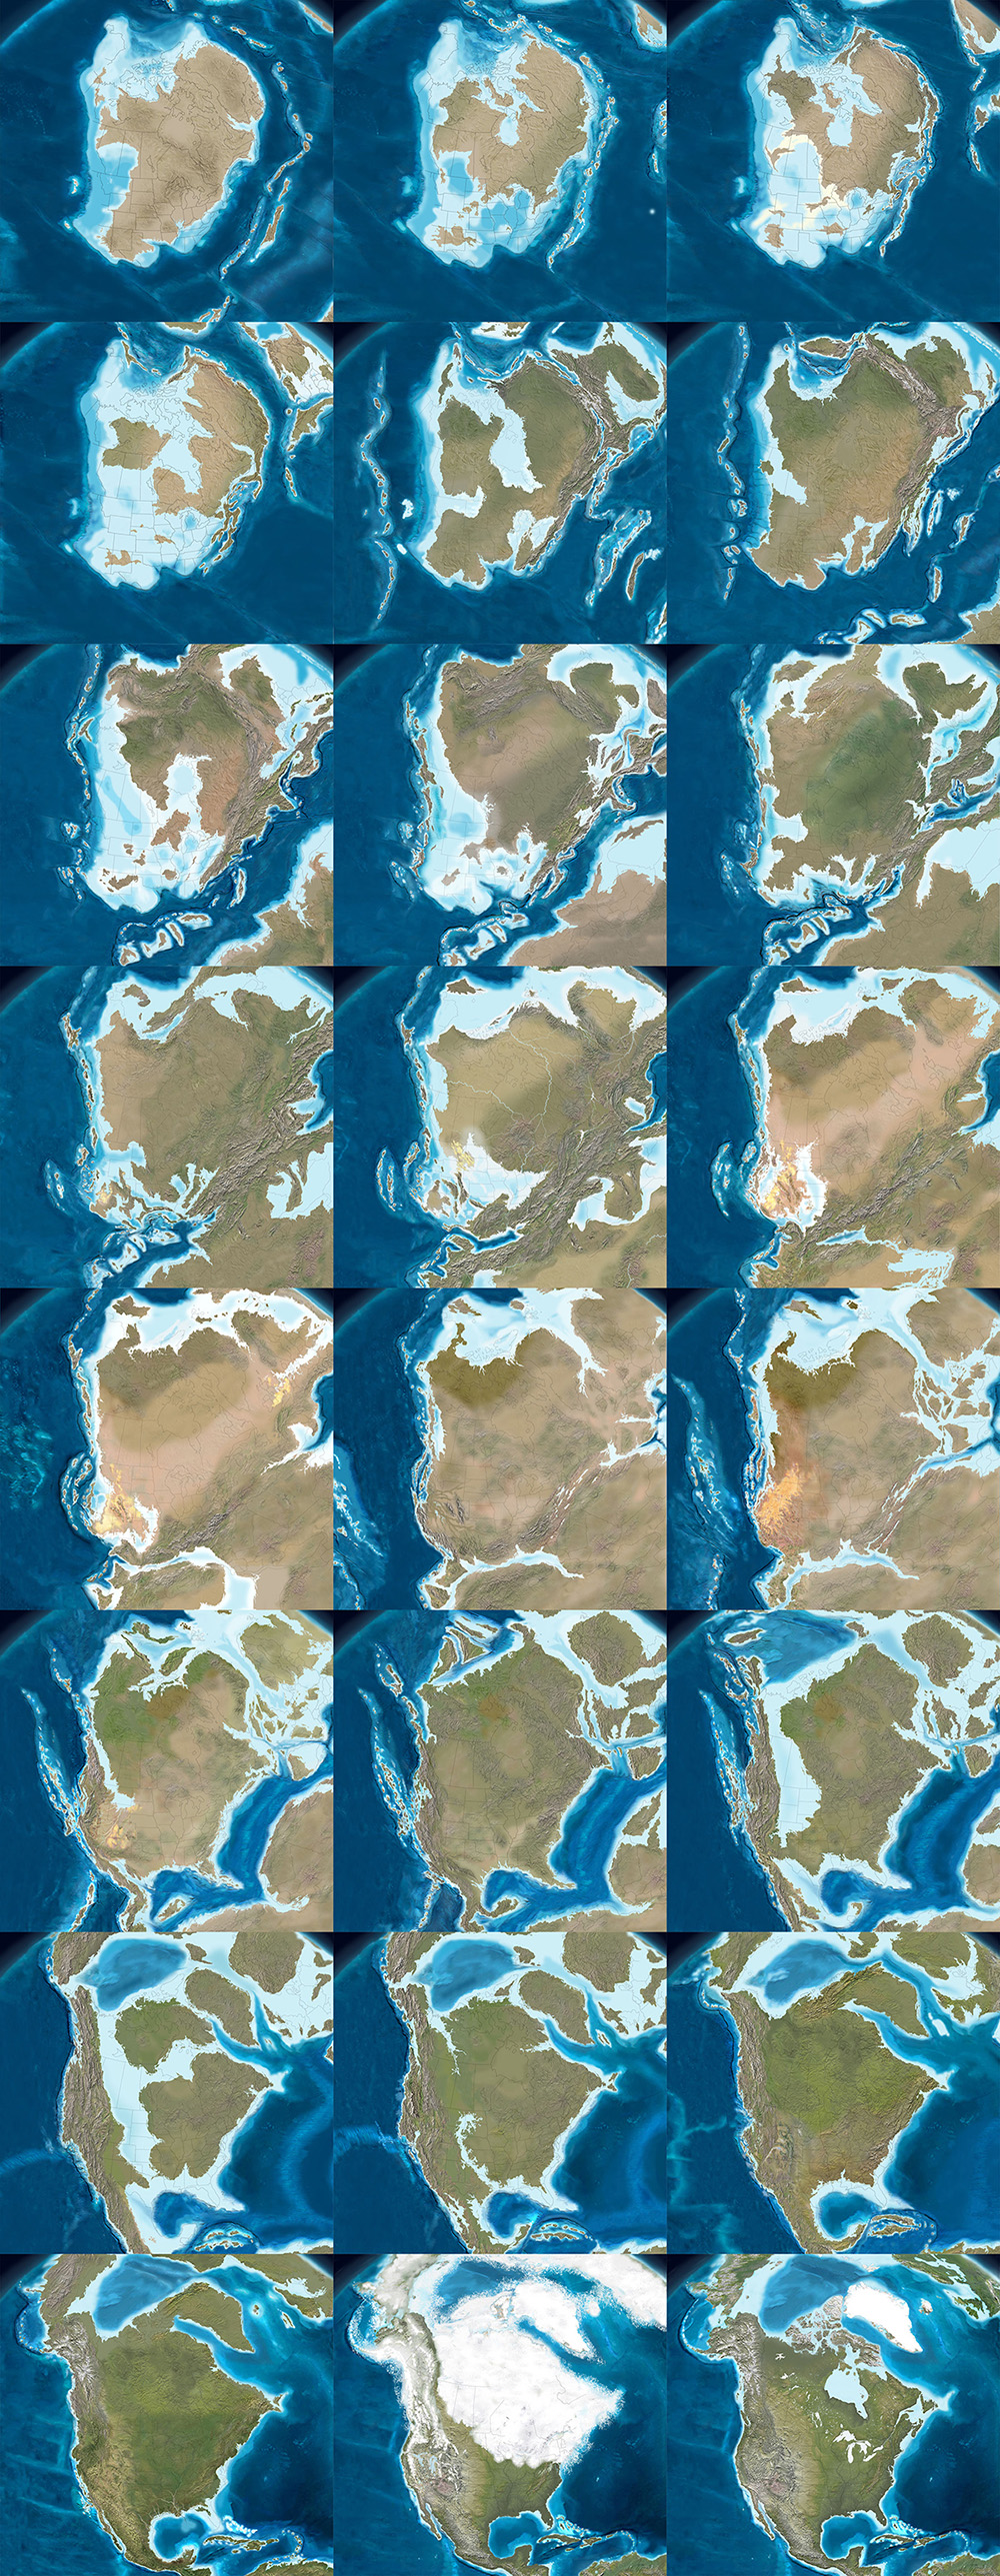

As part of BLDGBLOG’s collaborative side-project, Venue, Nicola Twilley and I met with Blakey in his Flagstaff home to talk about the tectonic processes that make and remake the surface of the Earth, the difficulty in representing these changes with both scientific accuracy and visual panache, and the specific satellite images and software tools he uses to create his unique brand of deep-time cartography.

Like film stills from a 600-million year-old blockbuster, Blakey’s maps take us back to the Precambrian—but there are much older eras still, stretching unmapped into far earlier continents and seas, and there are many more billions of years of continental evolution to come. Blakey talked us through some of the most complex changes in recent geological history, including the opening of the North Atlantic Ocean, and he allowed himself to speculate, albeit briefly, about where Earth’s continental crust might yet be headed (including a possible supercontinent in the Antarctic).

Many of Blakey’s maps are collected in the book Ancient Landscapes of the Colorado Plateau, written with Wayne Ranney, where Blakey also describes some of the research and methods that went into producing them. Blakey also contributed to the recent, new edition of a textbook by Wolfgang Frisch and Martin Meschede, Plate Tectonics: Continental Drift and Mountain Building, a thorough exploration of landscapes disassembling and colliding over vast spans of time.

• • •
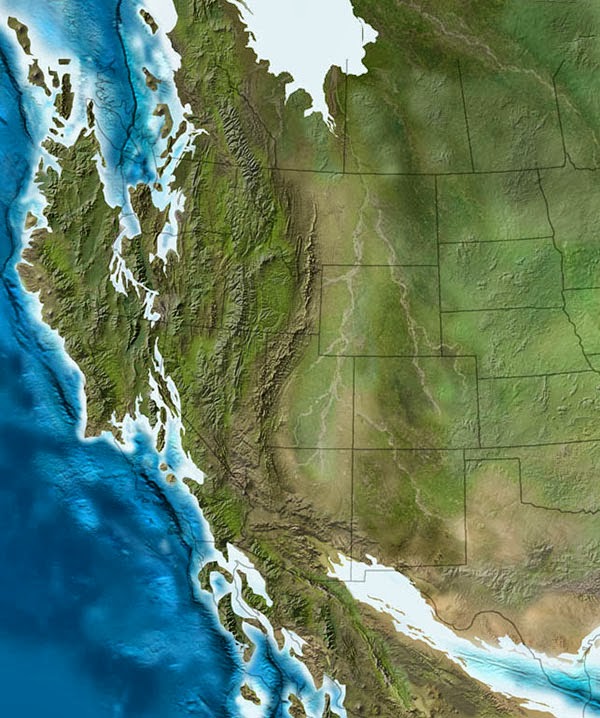
[Image: The west coast of North America, depicted as it would have been 130 million years ago; the coast is a labyrinth of islands, lagoons, and peninsulas slowly colliding with the mainland to form the mountains and valleys we know today. Map by Ron Blakey].

Geoff Manaugh: When I first discovered your maps showing the gradual tectonic re-location of the continents over hundreds of millions of years, I thought this was exactly what geologists should be doing: offering clear, step-by-step visual narratives of the evolution of the earth’s surface so that people can better understand the planet we live on. What inspired you to make the maps, and how did you first got started with them?

Ronald Blakey: Well, the very first maps I made were in conjunction with my doctoral thesis, back in the early 1970s. Those were made with pen and ink. I made sketches to show what the paleogeography would have looked like for the specific formation I was studying with my doctorate. Three or four of those maps went into the thesis, which was then published by the Utah Geologic Survey. I’ve also done a number of papers over the years where I’ve made sketches.

But I was late getting into the computer. Basically, during my graduate work I never used a computer for anything. I kind of resisted it, because, for the kind of work I was doing, I just didn’t see a need for it—I didn’t do quantifiable kinds of things. Then, of course, along comes email and the Internet. I actually forget when I first started with Photoshop—probably in the mid-1990s. When I found that, I just thought, wow: the power of this is incredible. I quickly learned how to use the cloning tool, so that I could clone modern topography onto ancient maps, and that made things even simpler yet.

Another thing I started doing was putting these maps into presentations. There were something like five different programs back there, in the late 90s, but the only one that survived was PowerPoint—which is too bad, because it was far from the best of the programs. I was using a program called Astound, which was far superior, particularly in the transitions between screens. I could do simple animations. I could make the tectonic plates move, create mountain belts, and so forth.

I retired in May of 2009, but all of my early maps are now online. With each generation of maps that I’ve done, there has been a noted improvement over earlier maps. I find new techniques and, when you work with Photoshop as much as I do, you learn new ideas and you find ways to make things that were a little clumsy look more smooth.

Manaugh: Where does the data come from?

Blakey: It comes from various publications. You can get a publication and have that PDF open, showing what something looked like in the past, and work from that. Usually, what I’m working from are fairly simple sketches published in the literature. They’ll show a subduction zone and a series of violent arcs, or a collision zone. What I do is take this information and make it more pictorial.

If you create a series of maps in sequence, you can create them in such a way that certain geologic events, from one time slice to the next, to the next, to the next, will blend. It depends a lot on the scale of what you’re trying to show—the whole world versus just four or five states in the West.

Now, throughout the years from, let’s say, 2004 until I retired in 2009, I kept improving the website. I envisioned most of this as educational material, and I didn’t pay much attention to who used it, how they used it, and so forth. But, then, shortly before I retired, various book companies and museums—and, most recently, oil companies—have approached me. So I started selling these and I tried very diligently not to allow this to overlap with what I was doing for my teaching and my research at the University.

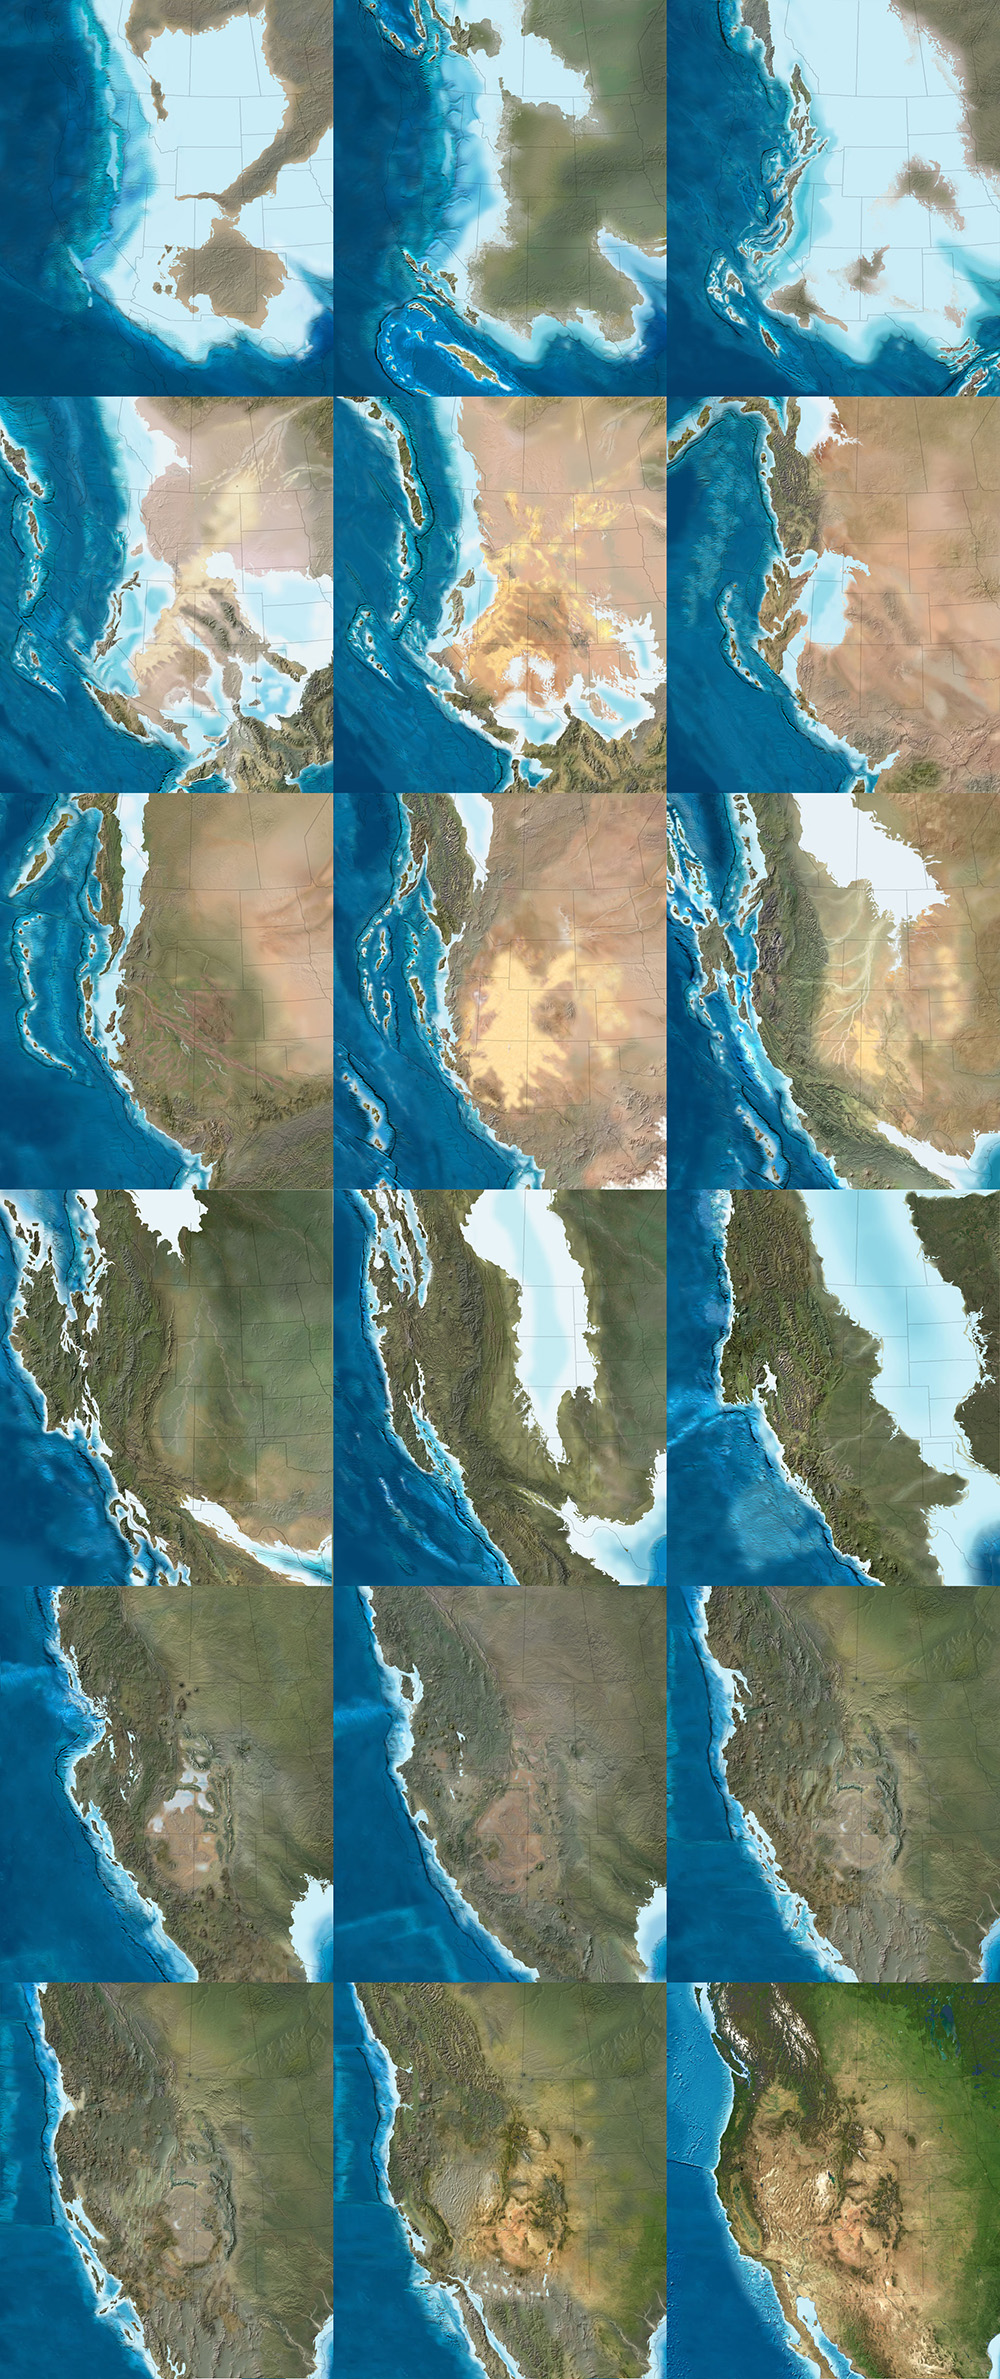
In the following long sequence of images, we see the evolution of the west coast of North America, its state boundaries ghosted in for reference. Sea levels rise and fall; island chains emerge and collide; mountains form; inland seas proliferate and drain; and, eventually, modern day California, Vancouver Island, and the Baja peninsula take shape, among other recognizable features. The time frame represented by these images is approximately 500 million years. All maps by Ron Blakey.

Nicola Twilley: What do the oil companies want them for?

Blakey: They’re my biggest customers now. Usually, the geologists at oil companies are working with people who know either much less geology than they do or, in some cases, almost no geology at all, yet they’re trying to convince these people that this is where they need to explore, or this is what they need to do next.

They find these maps very useful to show what the Devonian of North Dakota looked like, for example, which is a hot spot right now with all the shales that they’re developing in the Williston Basin. What they like is that I show what the area might have really looked like. This helps, particularly with people who have only a modest understanding of geology, particularly the geologic past.

Manaugh: What have been some of the most difficult regions or geological eras to map?

Blakey: The most difficult thing to depict is back in the Paleozoic and the Mesozoic. Large areas of the continent were flooded, deep into the interior.

During certain periods, like the Ordovician, the Devonian, and parts of the Jurassic—especially the Cretaceous—as much as two-thirds of the continents were underwater. But they’re still continents; they’re still continental crusts. They’re not oceans. The sea level was just high enough, with respect to where the landscape was at the time, that the area was flooded. Of course, this is a concept that non-geologists really have problems with, because they don’t understand the processes of how continents get uplifted and subside and erode and so forth, but this is one of the concepts that my maps show quite nicely: the seas coming in and retreating.

But it’s very difficult—I mean, there is no modern analog for a seaway that stretched from the Mackenzie River Delta in Canada to the Gulf of Mexico and that was 400 miles wide. There’s nothing like that on Earth today. But the styles of mountains have not dramatically changed over the last probably two billion years—maybe even longer than that. I don’t go back that far—I tend to stick with the last 600 million years or so—but the styles of mountains haven’t changed. The nature of island arcs hasn’t changed, as far as we know.

What has changed is the amount of vegetation on the landscape. My maps that are in the early part of the Paleozoic—the Cambrian and the Ordovician early part of the Silurian—tend to be drab-colored. Then, in the late Silurian and in the Devonian, when the land plants developed, I start bringing vegetation colors in. I try to show the broad patterns of climate. Not in detail, of course—there’s a lot of controversy about certain paleoclimates. But, basically, paleoclimates follow the same kinds of regimens that the modern climates are following: where the oceans are, where the equator is, where the mountain ranges are, and so forth.

That means you can make broad predictions about what a paleoclimate would have been based on its relationship to the equator or based on the presence or absence of nearby mountains. I use these kinds of principles to show more arid areas versus more humid areas.

The next three sequences show the evolution of the Earth’s surface in reverse, from the present day to, at the very bottom, 600 million years ago, when nearly all of the planet’s landmasses were joined together in the Antarctic. The first sequence shows roughly 90 million years of backward evolution, the continents pulling apart from one another and beginning a slow drift south. They were mapped using the Mollweide projection, and, in all cases, are by Ron Blakey.


Twilley: And you paint the arid area based on a contemporary analog?

Blakey: Right. I know the modern world reasonably well and I’ll choose something today that might have matched the texture and aridity of that older landscape.

I use a program called GeoMapApp that gives me digital elevation maps for anywhere in the world. Most recently, they have coupled it with what they call the “Blue Marble.” NASA has stitched together a bunch of satellite photos of the world in such a way that you can’t tell where one series of photos come in or another. It’s a fairly true-color representation of what Earth would look like from space. So this Blue Marble is coupled with the GeoMapApp’s digital elevation topography; you put the Blue Marble over it, and you use a little slider to let the topography show through, and it gives you a fairly realistic looking picture of what you’re looking for.

For example, if I’m working with a mountain range in the southern Appalachians for a Devonian map—well, the southern Appalachians, during the Devonian, were probably far enough away from the equator that it was in the arid belt. There are some indications of that, as well—salt deposits in the Michigan Basin and in parts of New York and so forth. Plus, there are red-colored sediments, which don’t prove but tend to indicate arid environments. This combination tells me that this part of the world was fairly arid. So I’m going to places like modern Afghanistan, extreme western China, northern Turkey, or other places where there are somewhat arid climates with mountain belts today. Then I clone the mountains from there and put them in the map.

But you have to know the geologic background. You have to know how the mountains were formed, what the grain of the mountains was. That’s not always easy, although there are ways of doing it. To know the grain of the mountains, you need to know where the hinterland and the center of the mountains were. You need to know where the foreland area is, so that you can show the different styles of mountains. You have to move from foreland areas—which tends to be a series of parallel ridges, usually much lower than the hinterlands—to the center and beyond.

I use this kind of information to pick the right kind of modern mountain to put back in the Devonian, based on what that Devonian landscape probably had a good chance of looking like. Do we know for certain? Of course not. We weren’t around in the Devonian. But we have a good rock record and we have a lot of information; so we use that information and, then, voilà.

To give another example, let’s look at the Devonian period of the east coast. The big European continent that we call Baltica collided with Greenland and a series of micro-continents collided further south, all the way down at least as far as New Jersey, if not down as far the Carolinas. We know that there are places on Earth today where these same kinds of collisions are taking place—in the Alps and Mediterranean region, and the Caucasus region, and so forth.

We can use the concept that, if two plates are colliding today to produce the Caucasus mountains, and if we look at the style of mountains that the Caucasus are, then it’s reasonable to think that, where Greenland and Baltica collided in the Silurian and the Devonian, the mountains would have had a similar style. So we can map that.

This second sequence shows the continents drifting apart, in reverse, from 105 million years ago to 240 million years ago. They were mapped using the Mollweide projection, and, in all cases, are by Ron Blakey.


Manaugh: That collision alone—Baltica and Greenland—sounds like something that would be extremely difficult to map.

Blakey: Absolutely. And it’s not a one-to-one relationship. You have to look at the whole pattern of how the plates collided, how big the plates were, and so forth.

Then there’s the question of the different histories of particular plates. So, for example, most of Scotland started out as North America. Then, when all the continents collided to form Pangaea, the first collisions took place in the Silurian-Devonian and the final collisions took place in the Pennsylvanian-Permian. By, say, 250 million years ago, most of the continents were together. Then, when they started to split apart in the Triassic and Jurassic—especially in the Triassic and Cretaceous—the split occurred in such a way that what had been part of North America was actually captured, if you will, by Europe and taken over to become the British Isles.

Scotland and at least the northern half of Ireland were captured and began to drift with Europe. On the other hand, North America picked up Florida—which used to be part of Gondwana—and so forth.

One of the things that is interesting is the way that, when mountains come together and then finally break up, they usually don’t break up the same way that they came together. Sometimes they do, but it has to do with weaknesses, stress patterns, and things like this. Obviously, all time is extremely relative, but mountains don’t last that long. A given mountain range that’s been formed by a simple collision—not that there’s any such thing as a simple collision—once that collision is over with, 40 or 50 million years after that event, there is only low-lying landscape. It may have even have split apart already into a new ocean basin.

But here’s the important part: the structure that was created by that collision is still there, even though the mountains have been worn down. It’s like when you cut a piece of wood: the grain is still inherited from when that tree grew. The pattern of the grain still shows where the branches were, and the direction of the tree’s growth in response to wind and sun and its neighbors. You can’t reconstruct the tree exactly from its grain, but, if you’re an expert with wood, you should be able to look and say: here are the tree rings, and here’s a year where the tree grew fast, here’s a year where the tree grew slow, here’s where the tree grew branches, etc.

In a sense, as geologists, we’re doing the same things with rock structure. We can tell by the pattern of how the rocks are deformed which direction the forces came from. With mountains, you can tell the angle at which the plates collided. It’s usually very oblique. What that tends to do is complicate the geologic structure, because you not only get things moving one way, but you get things dragging the other way, as well. But we can usually tell the angle at which the plates hit.

Then, in many cases, based upon the nature of how the crust has been deformed and stacked up, we can tell the severity of the mountain range. It doesn’t necessarily mean that we can say: oh, this structure would have been a twenty-thousand-foot high mountain range. It’s not that simple at all, not least of which because rocks can deform pretty severely without making towering mountains.

This final of the three global sequences shows the continents drifting apart, in reverse, from 260 million years ago to 600 million years ago. There was still nearly 4 billion years of tectonic evolution prior to where these maps begin. They were mapped using the Mollweide projection, and, in all cases, are by Ron Blakey.


Manaugh: Are you able to project these same tectonic movements and geological processes into the future and show what the earth might look like in, say, 250 million years?

Blakey: I’ve had a number of people ask me about that, so I did make some global maps. I think I made six of them at about 50-million-year intervals. For the fifteen to 100-million-year range, I think you can say they are fairly realistic. But, once you get much past 75 to 100 million years, it starts to get really, really speculative. The plates do strange things. I’ll give you just a couple of quick examples.

The Atlantic Ocean opened in the beginning of the Jurassic. The actual opening probably started off the coasts of roughly what is now Connecticut down to the Carolinas. That’s where the first opening started. So the central part of the Atlantic was the first part to open up. It opened up reasonably simply—but, again, I’m using the word simple with caution here.

The north Atlantic, meanwhile, didn’t open up until about 60 to 50 million years ago. When it opened up, it did a bunch of strange things. The first opening took place between Britain and an offshore bank that’s mostly submerged, called Rockall. Rockall is out in the Atlantic Ocean, northwest of Ireland—near Iceland—but it’s continental crust. That splitting process went on for, let’s say, ten million years or so—I’m just going to talk in broad terms—as the ocean started opening up.

Then the whole thing jumped. A second opening began over between Greenland and North America, as Greenland and North America began to separate off. That lasted for a good 40 or 50 million years. That’s where you now get the Labrador Sea; that is actual ocean crust. So that was the Atlantic Ocean for thirty or forty million years—but then it jumped again, this time over between Greenland and what is now the west coast of Europe. It started opening up over there, before it jumped yet again. There’s an island in the middle of the North Atlantic, way the heck up there, called Jan Mayen. At one time, it was actually part of Greenland. The Atlantic opened between it and Greenland and then shifted to the other side and made its final opening.

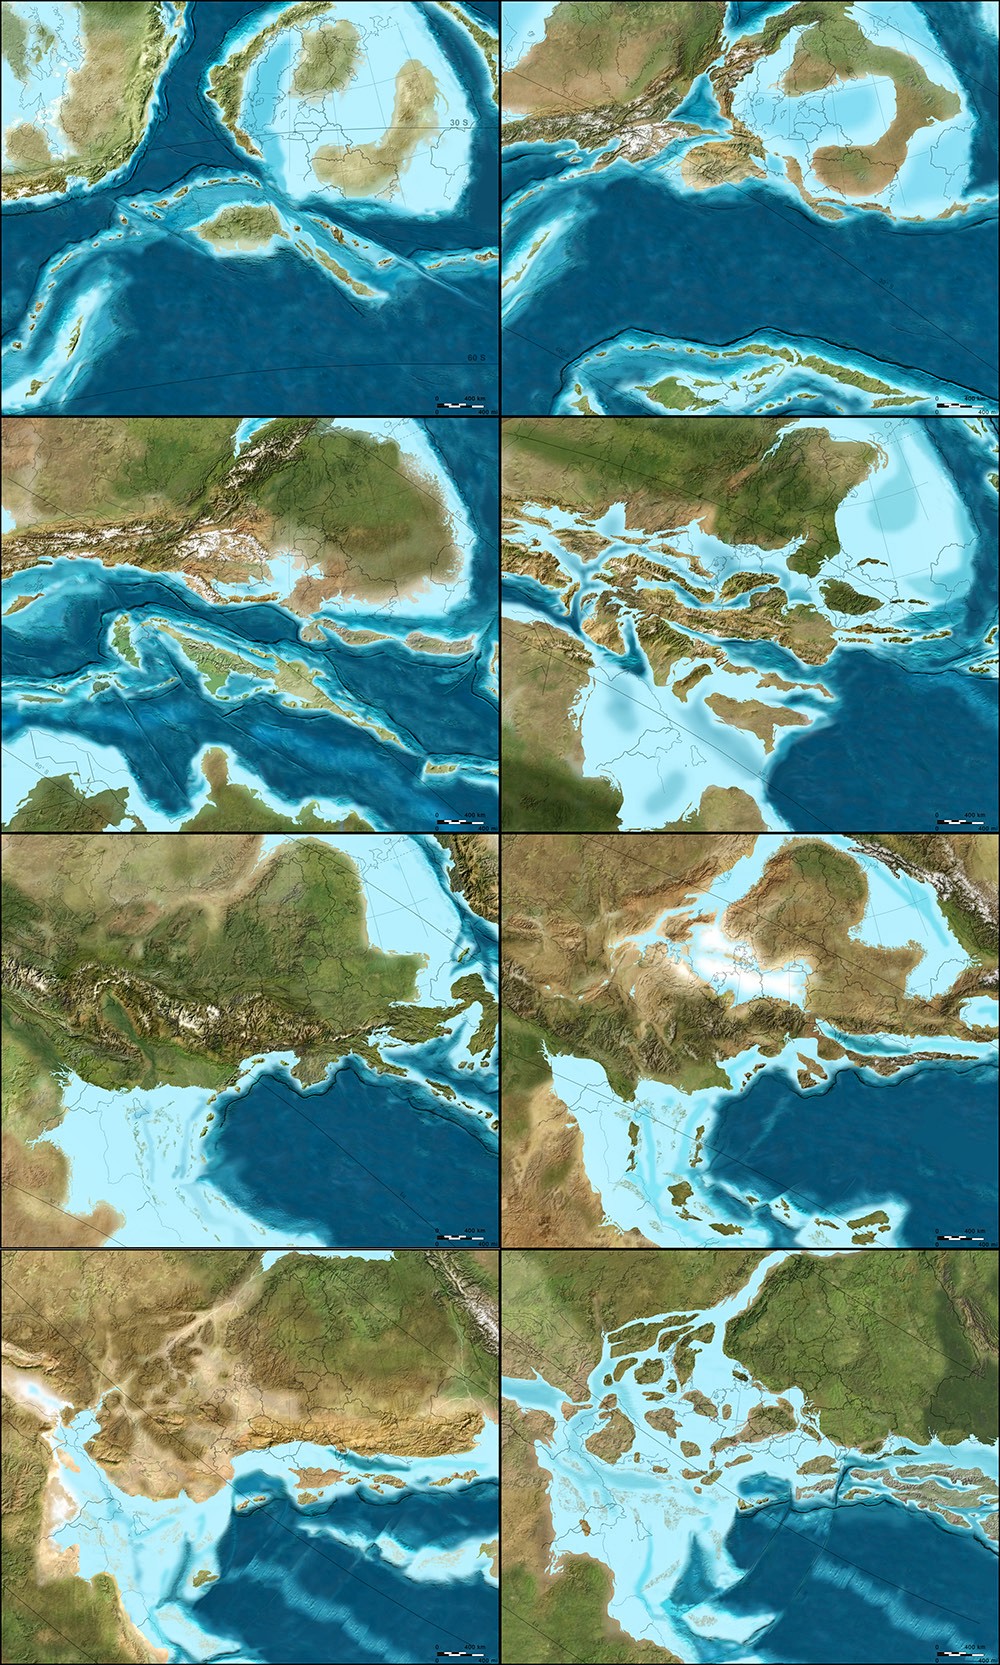
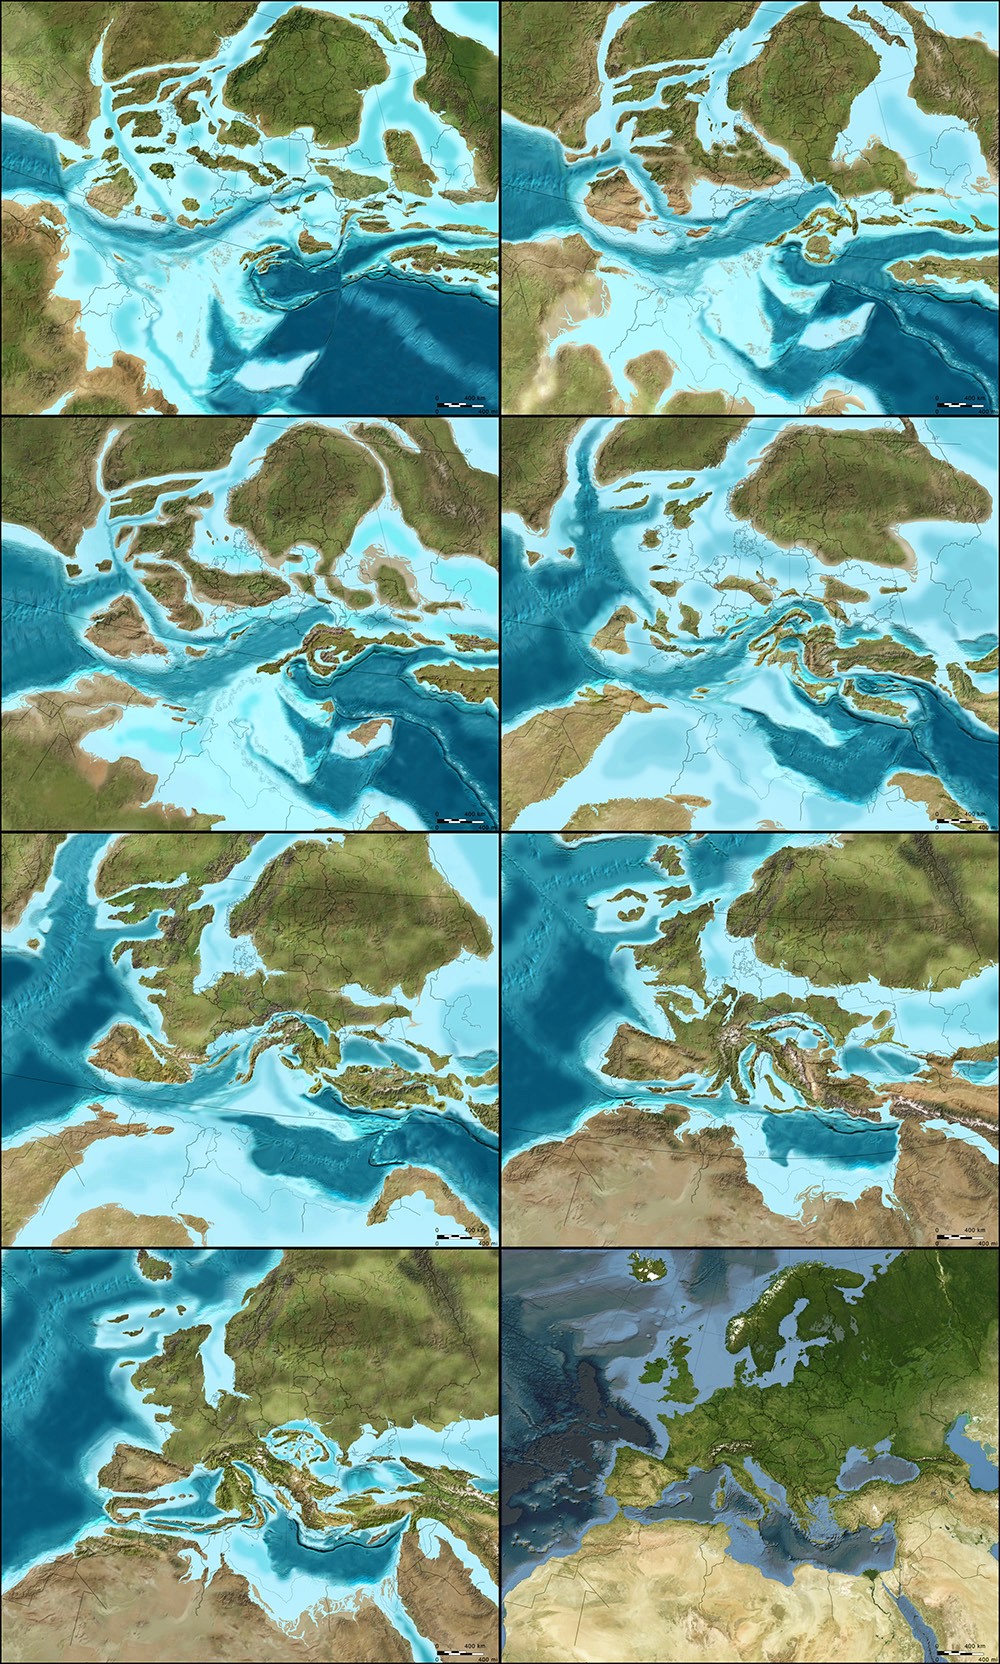
The following two sequences show the evolution of Europe from an Antarctic archipelago to a tropical island chain to the present day Europe we know and recognize. The first sequence starts roughly 450 million years ago and continues to the Jurassic, 200 million years ago. All maps by Ron Blakey.

So it’s very complicated. And that’s just the Atlantic Ocean.

The Northern Atlantic took at least five different paths before the final path was established, and it’s all still changing. In fact, the south Atlantic is actually even worse; it’s an even bigger mess. You’ve got multiple openings between southwest Africa and Argentina, plus Antarctica was up in there before it pulled away to the south.

These complications are what makes this stuff so interesting. If we look at events that we can understand pretty well over the last, let’s say, 150 or 200 million years of time—where we have a good indication of where the oceans were because we still have ocean crusts of that age—then we can extrapolate from that back to past times when oceans were created and destroyed. We can follow the rules that are going on today to see all of the oddities and the exceptions and so forth.

These are the kinds of things I try to keep track of when I’m making these maps. I’m always asking: what do we know? Was it a simple pull-apart process? There are examples where continents started to split across from one another, then came back together, then re-split in a different spot later on. That’s not just speculation—there is geologic evidence for this in the rock record.

So, when it comes to extrapolating future geologies, things become very complicated very quickly. If you start thinking about the behavior of the north Atlantic, creating a projection based on what’s going on today seems, at first, like a fairly simple chore. North America is going on a northwesterly path at only one or two centimeters a year. Europe is moving away, at almost a right angle, at about another centimeter a year. So the Atlantic is only opening at three centimeters a year; it’s one of the slowest-opening oceans right now.

OK, fine—but what else is happening? The Caribbean is pushing up into the Atlantic and, off South America, there is the Scotia Arc. Both of those are growing. They’ve also identified what looks like a new island arc off the western Mediterranean region; that eventually would start to close the Atlantic in that area. Now you start to speculate: well, these arcs will start to grow, and they’ll start to eat into the oceans, and subduct the crusts, and so forth.

Again, for the first 50, 75, or even 100 million years, you can say that these particular movements are fairly likely. But, once you get past that, you can still use geologic principles, but you’re just speculating as to which way the continents are going to go.

For instance, the one continent that does not seem to be moving at all right now, relative to anything else, is Antarctica. It seems to be really fixed on the South Pole. That’s why some people think that everything will actually coagulate back towards the South Pole. However, there are also a bunch of subduction zones today along southern Asia, and those are pretty strong subduction zones. Those are the ones that created the big tsunami, and all the earthquakes off of Indonesia and so forth. Eventually, those could pull either parts of Antarctica or all of Antarctica up toward them.

But I’m more interested in reconstructing the past than I am the future, so I’ve only played around with those five or six maps.

This second sequence, showing the next phase in the evolution of Europe, begins approximately 150 million years ago and extends to the present day. All maps by Ron Blakey.

Manaugh: To ground things a bit, we’re having this conversation in Flagstaff, on the Colorado Plateau, which seems like a great place to teach geology. I wonder whether there might be another Colorado Plateau, so to speak, elsewhere in the world—something geologically similar to the extraordinary landscapes we see here that just hasn’t had the chance to emerge. Maybe the tectonics aren’t right, and it’s still just a crack, rather than a canyon, or maybe it’s covered in vegetation or ice so we can’t see it yet. Conversely, I’m curious if you might have found evidence of other great geological districts in the earth’s past—lost Grand Canyons, other Arches National Parks—that have been lost to time. How could we detect those, and where are they?

Blakey: This is indeed a great place to teach geology. It’s a great place to live.

As for Colorado Plateau analogs—it’s an interesting question. There’s an area in South America that I’d say is fairly similar. It’s got a couple of famous national parks that I can’t remember the name of. It’s a smaller version, but it’s very similar to the Colorado Plateau. It’s between the Andes and the Amazon basin, part of the general pampas region there of South America. It even has similarly aged rocks. Parts of northern Africa would also be similar.

But you have to look at all the characteristics of the Plateau. Number one: the rocks are flat. Number two: the rocks have been uplifted. Number three: the rocks are dissected by a major river system. Number four: it’s a semi-arid climate. There are probably five or six defining characteristics in total, and I’ve heard many people say that there is no other place else on Earth that has all those characteristics in exactly the same way. But I went to an area in eastern Mauritania many years ago, where, for all the world, it looked like the Grand Canyon. It wasn’t as colorful, but it was a big, deep canyon.

In fact, the Appalachian Plateau would be somewhat similar, except it’s in a humid climate, which means the land has been shaped and formed differently. But the Appalachian plateau has flat-lying rocks; it’s dissected by some major rivers; it’s experienced uplift; and so forth.

The next two sequences of images, followed from left to right, top to bottom, illustrate the gradual evolution of the Colorado Plateau, where, in its modern day incarnation, this interview with Ron Blakey took place (specifically, in Flagstaff, Arizona. The earliest map included here depicts the Proterozoic; the first sequence ends in the Triassic. All maps by Ron Blakey.
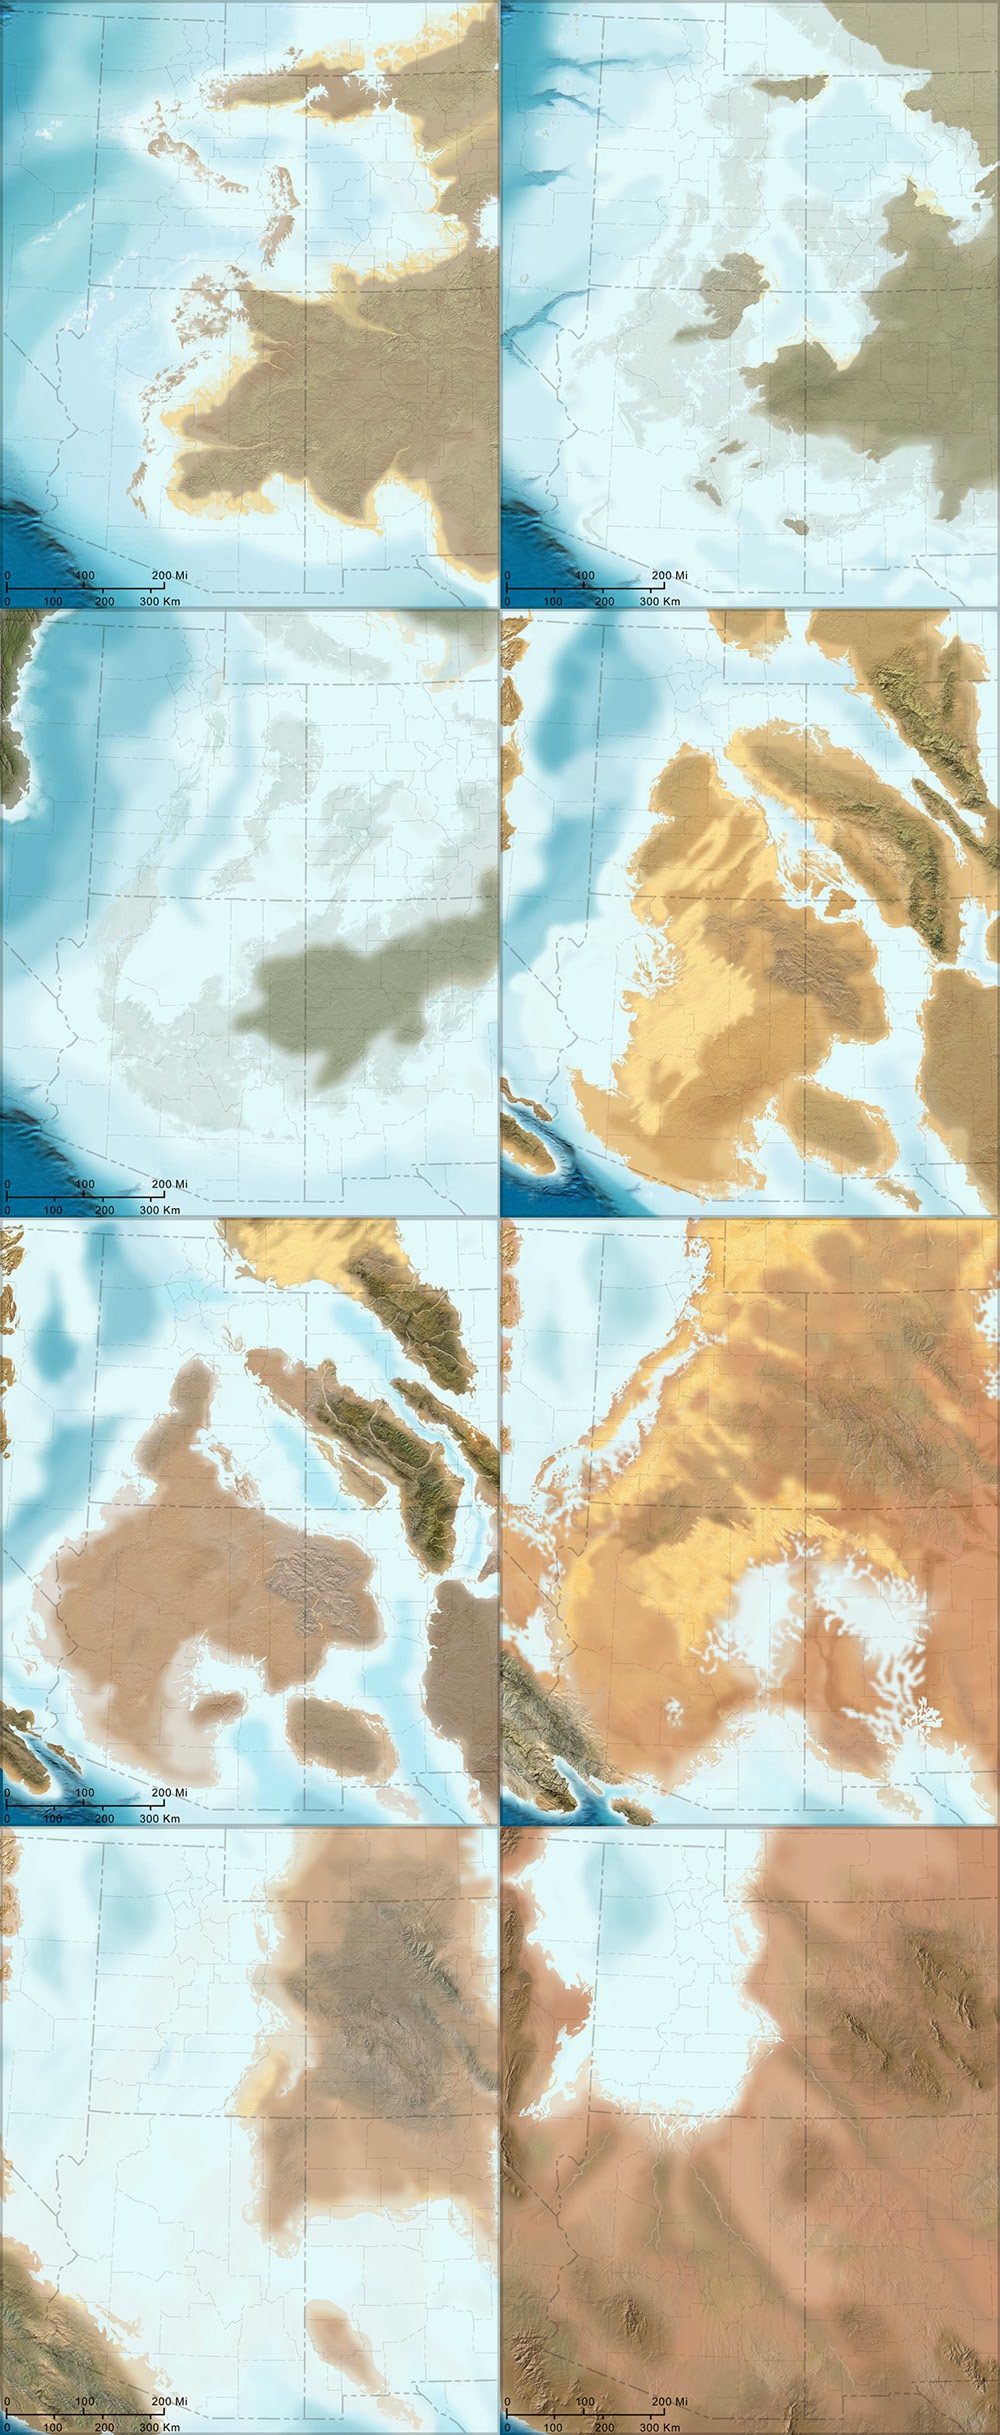

Twilley: I’m interested in the representational challenges you face when you decide to make a map, and, specifically, when you’re in Photoshop, what your most-used tools might be. I thought it was fascinating when you said that the cloning tool really changed how you make geological maps. What other techniques are important to you, in order to represent geological histories?

Blakey: Oh, the cloning tool is the most important, by far—at least when I’m actually painting. Of course, I use the outline tool to select areas, but, when I’m actually painting, it would be impossible to paint these different maps pixel by pixel. I couldn’t do it. Occasionally, I will actually hand-draw some things in the flatlands, where I want to put a river system, for example, but, at least for mountains and rugged terrain, I clone everything.

Some times, I’ll cut and paste. I’ll select an area in the GeoMapApp, I save it as a JPEG, and then I can select it and copy it and paste it in, and I can rotate and deform it a little bit. Are you familiar with the warp tool in Photoshop? I use that a lot, because you can change the shape of mountains a little. If you do it too dramatically, it really looks flaky. But, if you do it right, it still looks pretty realistic.

This second sequence, also showing the evolution of the Colorado Plateau, begins with the Triassic and ends roughly 5 million years ago—basically the present day, in geological terms. All maps by Ron Blakey.


Twilley: And do you have certain filters you rely on for particular geological effects?

Blakey: A little bit. I like to use the craquelure filter. It actually gives you little bumps and valleys and so forth. I use that especially for continental margins. Continental margins are anything but regular slopes, going down to the abyssal depths. They’re very irregular. There are landslides and all kinds of things going on there at the margins, so I add a little texture with craquelure.

It can be difficult to use, though, and it doesn’t work at really high resolutions—so, what I actually have to do some times, is that I will actually copy a part of my map, take it out, make it smaller, do the craquelure on it, and then blow it back up and paste it in again.
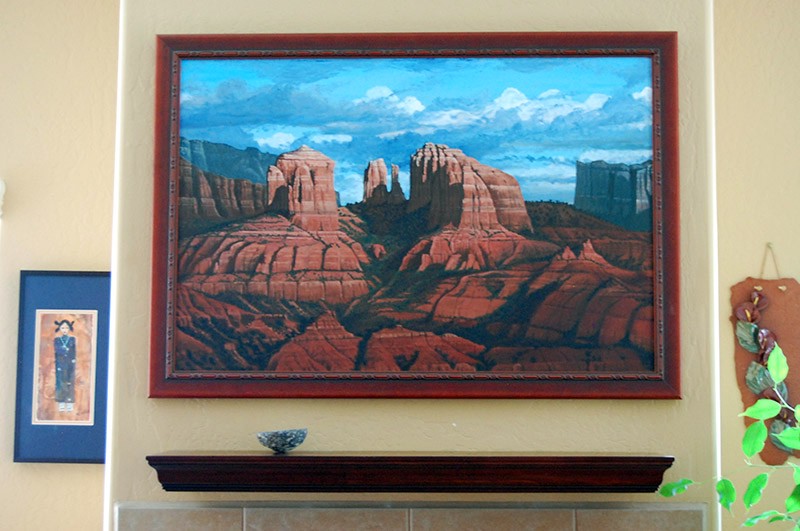
[Image: A painting by Ron Blakey depicts a geological landscape near Sedona, Arizona].

Dee Blakey, Ron’s Wife: I think the other reason that he can do what he does is that he paints. That’s one of his paintings over there. [gestures above fireplace]

Blakey: Well, I guess I should have said that right away, when you asked me why I got interested in this, because I am interested in the artistic aspect of geology. The artistic aspect of science, in general, but especially geology. Astronomy, for example, would be another field where artistic visualizations are useful—any time you’re trying to show things that can’t easily be visualized with something comparable here on present-day planet Earth, you have to use an artistic interpretation.

Anyway, I can’t explain it, but I understand color pretty well. I use the hue saturation tool a lot. I’ll select an area and then I’ll feather it, let’s say, because you don’t want the edges to be sharp. I’ll feather it by thirty, forty, fifty pixels. Then I’ll take the slider for hue saturation, where, if you go to the left, you make things redder and, if you go to the right, you make things greener. If I’ve got a landscape that looks a little too humid, I’ll just slide it slightly to the left to make it a bit redder. You can also change the lightness and darkness when you do that. There’s also regular saturation. By killing the saturation, you can really kill the nature of a landscape quite a bit.

And I use hue saturation a lot. That took me a long time to master, because it’s really easy to screw things up with that tool. You start sliding things a little too far and, whoa—wait a minute! All of a sudden, you’ve got purple mountains.

• • •

For more Venue interviews, be sure to stop by the Venue website.
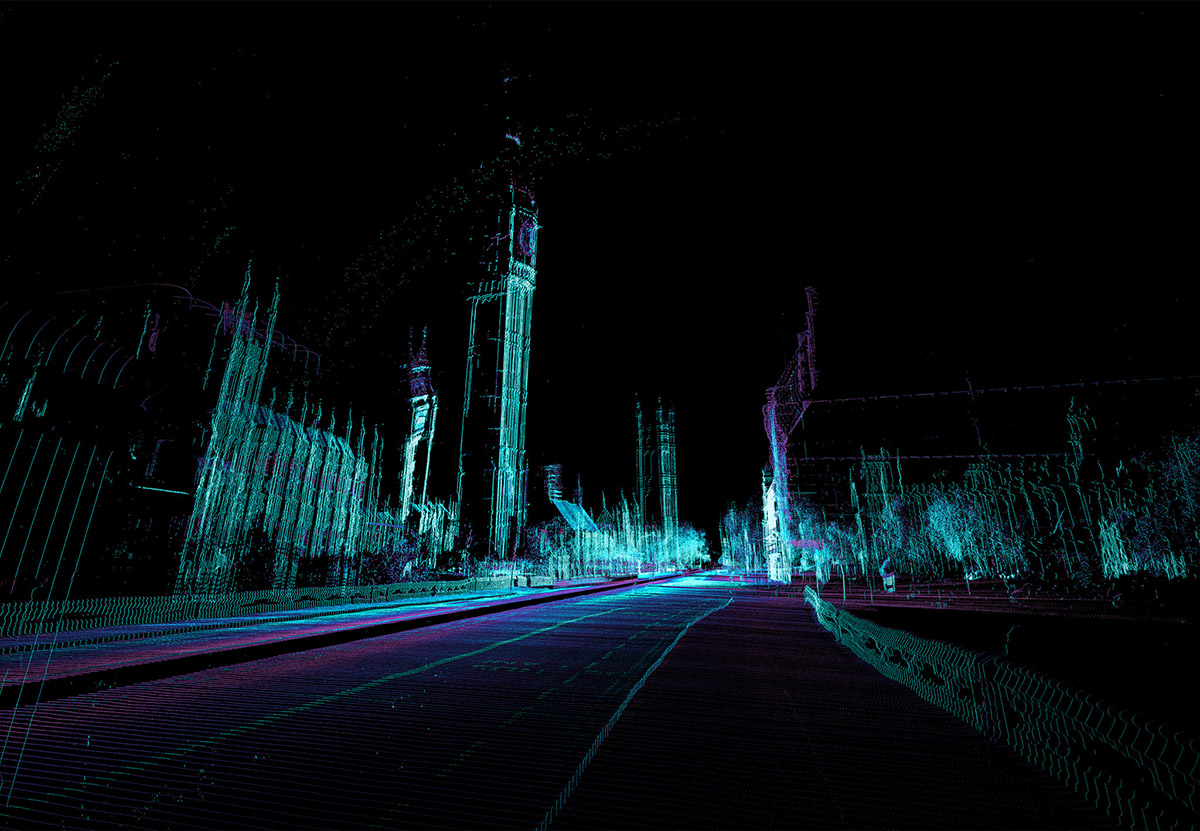
Landscape Futures Arrives

[Image: Internal title page from Landscape Futures; book design by Everything-Type-Company].

At long last, after a delay from the printer, Landscape Futures: Instruments, Devices and Architectural Inventions is finally out and shipping internationally.

I am incredibly excited about the book, to be honest, and about the huge variety of content it features, including an original essay by Elizabeth Ellsworth & Jamie Kruse of Smudge Studio, a short piece of landscape fiction by Pushcart Prize-winning author Scott Geiger, and a readymade course outline—open for anyone looking to teach a course on oceanographic instrumentation—by Mammoth’s Rob Holmes.

These join reprints of classic texts by geologist Jan Zalasiewicz, on the incipient fossilization of our cities 100 million years from now; a look at the perverse history of weather warfare and the possibility of planetary-scale climate manipulation by James Fleming; and a brilliant analysis of the Temple of Dendur, currently held deep in the controlled atmosphere of New York’s Metropolitan Museum of Art, and its implications for architectural preservation elsewhere.

And even these are complemented by an urban hiking tour by the Center for Land Use Interpretation that takes you up into the hills of Los Angeles to visit check dams, debris basins, radio antennas, and cell phone towers, and a series of ultra-short stories set in a Chicago yet to come by Pruned‘s Alexander Trevi.

[Images: A few spreads from the “Landscape Futures Sourcebook” featured in Landscape Futures; book design by Everything-Type-Company].

Of course, everything just listed supplements and expands on the heart of the book, which documents the eponymous exhibition hosted at the Nevada Museum of Art, featuring specially commissioned work by Smout Allen, David Gissen, and The Living, and pre-existing work by Liam Young, Chris Woebken & Kenichi Okada, and Lateral Office.

Extensive original interviews with the exhibiting architects and designers, and a long curator’s essay—describing the exhibition’s focus on the intermediary devices, instruments, and spatial machines that can fundamentally transform how human beings perceive and understand the landscapes around them—complete the book, in addition to hundreds of images, many maps, and an extensive use of metallic and fluorescent inks.

The book is currently only $17.97 on Amazon.com, as well, which seems like an almost unbelievable deal; now is an awesome time to buy a copy.

[Images: Interview spreads from Landscape Futures; book design by Everything-Type-Company].

In any case, I’ve written about Landscape Futures here before, and an exhaustive preview of it can be seen in this earlier post.

I just wanted to put up a notice that the book is finally shipping worldwide, with a new publication date of August 2013, and I look forward to hearing what people think. Enjoy!

Skyfall

Although the Earth itself will be coming to its fiery and magmatic end in 7 billion years’ time, its nighttime skies will be undergoing an extraordinary slow-motion light-show: the merging of the Milky Way and Andromeda galaxies.

An animation released last summer by NASA, called “What the Night Sky Will Look Like Over the Next 7 Billion Years” and embedded above, depicts the glowing filaments of these two galaxies, like plate tectonics in space, crashing together, gravitationally distorting one another, and then merging in a featureless cloud of light.

[Image: Via HubbleSite].

In his weird, brilliant, and unimaginably dense book The Invention of the Zero poet Richard Kenney exclaims, “Imagine, all new constellations! …a seethe / and flume of unfamiliar skies.”

But such skies are not merely the domain of speculative poetry, as they are, in fact, on their way, roiling toward us in billion-year-long collisions that we, as a species, will never see the true light of.

[Image: Via HubbleSite].

I’m reminded of an essay by geologist Steven Dutch, at the University of Wisconsin, Green Bay, called “The Earth Has A Future,” originally published in the May 2006 issue of Geosphere.

Advocating what he calls a “futurist approach” to the planetary sciences, Dutch points out that “a million years is relatively short in geologic terms. For example, even the fastest plates, moving on the order of 15 cm/yr, will have moved only 150 km in a million years, enough to have very significant local geological effects but scarcely enough to be casually noticeable on a globe.”

However, Dutch’s “futurist approach” to landscape studies becomes particularly fascinating when he turns his attention upward, to the sky, looking out beyond the Earth to what stars and their constellations might look like in roughly one million years. Dutch predicts, for instance, that “distant star patterns like Orion should be recognizable” for several hundred thousand years, “but many constellations will have changed noticeably.”

In other words, the sky is always—even now—adrift, already fulfilling Kenney’s “seethe and flume of unfamiliar skies.”

[Image: Via HubbleSite].

But that’s just a million years. Multiply that by seven-and-a-half thousand, and the heavenly distortions torquing through the skies above us become magical even to contemplate.

(Related: Pruned‘s Proposal for an Ideas Competition Seeking Design Proposals for a Pavilion for Viewing the Coming Intergalactic Collision between Andromeda and the Milky Way).