American Mine

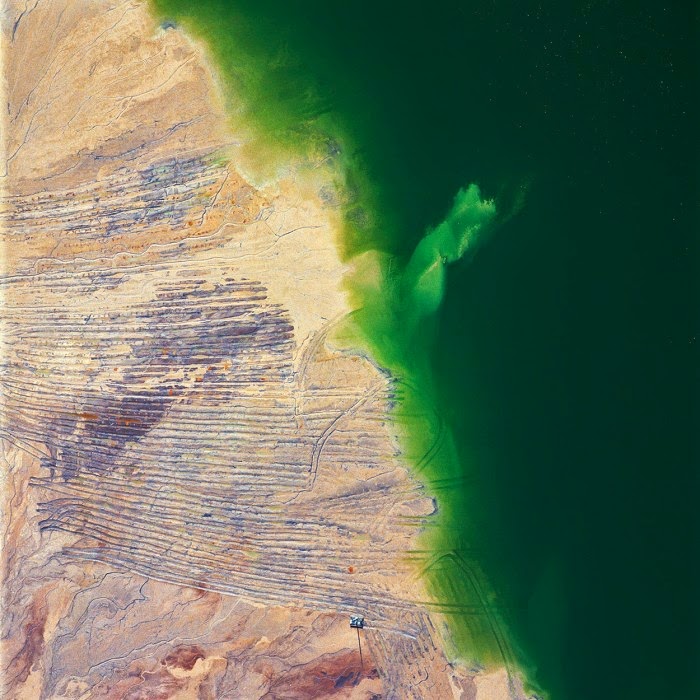
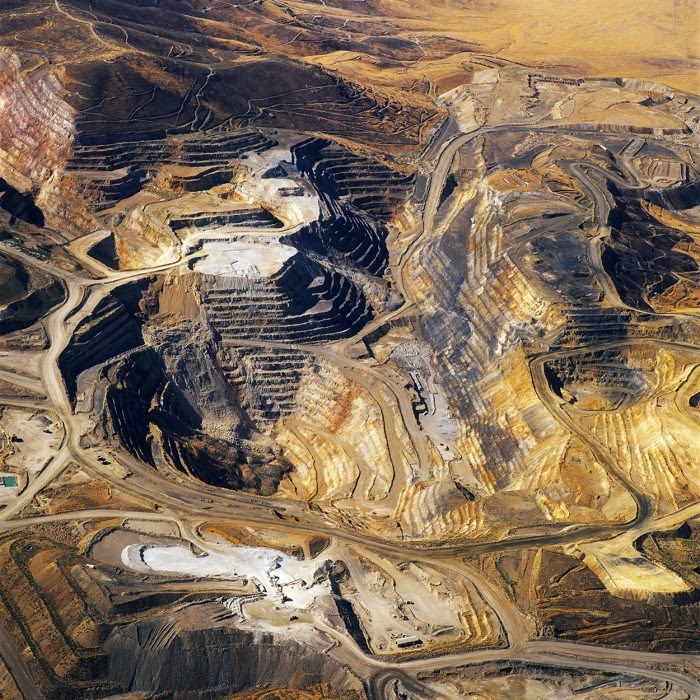
[Image: “American Mine (Carlin, Nevada 2, 2007)” by David Maisel].

The following essay was previously published under the title “Infinite Exchange” in Black Maps by David Maisel (Steidl), as well as in Cabinet Magazine #50.

1.
In a 2011 paper on the medical effects of scurvy, author Jason C. Anthony offers a remarkable detail about human bodies and the long-term presence of wounds.

“Without vitamin C,” Anthony writes, “we cannot produce collagen, an essential component of bones, cartilage, tendons and other connective tissues. Collagen binds our wounds, but that binding is replaced continually throughout our lives. Thus in advanced scurvy”—reached when the body has gone too long without vitamin C—“old wounds long thought healed will magically, painfully reappear.”

In a sense, there is no such thing as healing. From paper cuts to surgical scars, our bodies are catalogues of wounds: imperfectly locked doors quietly waiting, sooner or later, to spring back open.

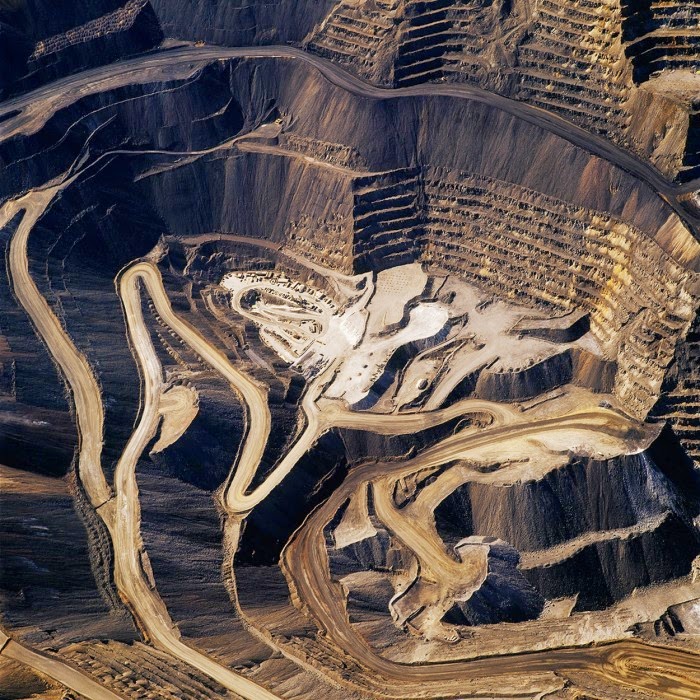
[Image: “American Mine (Carlin, Nevada 5, 2007)” by David Maisel].

2.
The Carlin Trend was discovered in north-central Nevada, near the town of Elko, in 1962. Some fifty years later, at this time of writing, it remains one of the world’s largest actively mined deposits of gold ore. In fact, the region has become something of a category-maker in the gold industry today, which describes analogous landscapes and ore bodies as “Carlin-type” deposits. The Carlin Trend is a standard, in other words: a referent against which others are both literally and rhetorically measured.

The trend’s discovery and subsequent exploitation—and the extraordinary negative landforms that have resulted from its exhumation—has been a story of nineteenth-century U.S. mining laws, legally dubious provisions governing public land, extraction industry multinationals, advanced geological modeling software, specialty equipment few people can name let alone operate, and genetically modified bacteria mixed into vats of gold-harvesting slurry.

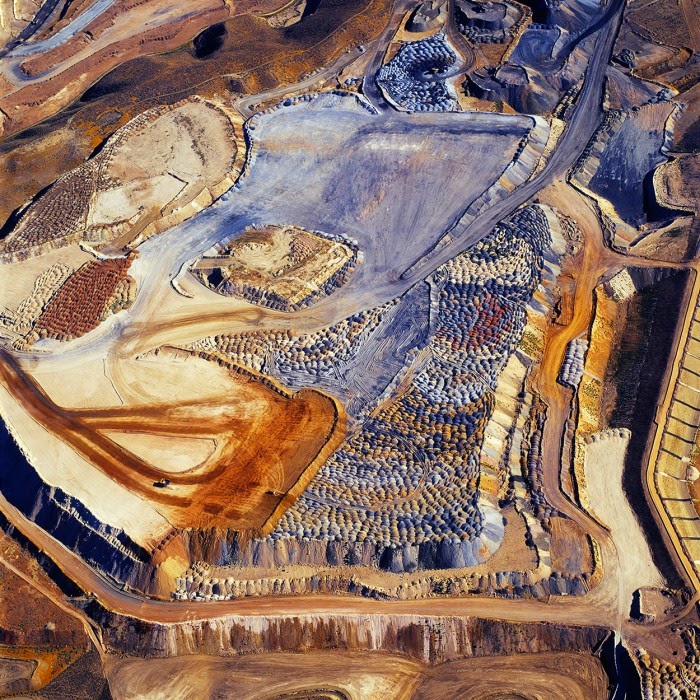
[Image: “American Mine (Carlin, Nevada 1, 2007)” by David Maisel].

Writing in 1989, John Seabrook of The New Yorker pointed out that, in the previous eight years alone, more gold had been mined from the Carlin Trend “than came out of any of the bonanzas that feature so prominently in our national mythology, including the California bonanza of 1849.” That’s because gold in the region is all but ubiquitous, peppered and snaked throughout Nevada:

There is gold in the Battle Mountain Formation, the range that runs southeast of town; gold in the alluvium to the west; gold in the Black Rock Desert to the northwest; gold in the Sheep Creek Range and in the Tuscarora Mountains to the northeast. The Tuscaroras are especially rich. Along the Carlin Trend, a forty-mile stretch of this range, are twelve deposits. Some people believe that a much richer swatch of ore, a deposit to rival South Africa’s Gold Reef, runs unbroken under the Carlin Trend, perhaps three thousand feet down—more than three times as deep as the deepest mines there now go.

“Some people believe”: more is hidden in the apparent neutrality of Seabrook’s phrase than we might at first suspect. Mining for gold—the actual, violent excision of waste rock from the earth, searching for ore—is never a question of finding a perfect, shiny lump of solid metal and carefully, surgically removing it from the planet. Gold is diffuse. It is now more often mined as particles, not blocks or even nuggets. Like glitter, it is scattered throughout the rocks around it.

In fact, the presence of gold, in many cases, can only be inferred. The angle at which local rock strata dip back into the planet, the direction water flows through the landscape, or the complex of other minerals and crystals locked in the rocks underground: these all, to varying degrees, act as telltale signatures for the famously coy king of metals.

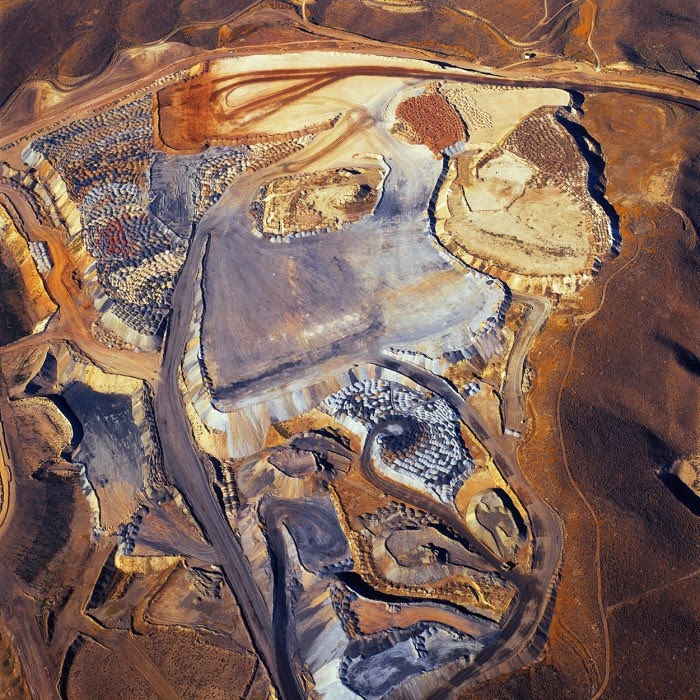
[Image: “American Mine (Carlin, Nevada 18, 2007)” by David Maisel].

Looking for these signatures entails a peculiar mix of local folklore and verified science, and the hunt—sometimes life-consuming, sometimes maddening—for signs is exhaustively documented by what Seabrook calls “prospecting paraphernalia: geological reports, assay figures, maps, contracts, aerial photographs, electromagnetic surveys, gravitometer readings, lawsuits, letters from people who think they have gold on their property, letters from people who know people who have gold on their property.”

Gold is less discovered, we might say, than interpreted.

The Carlin Trend has thus served as a test site, now in its fifty-first year, for various interpretive techniques, both scientific and superstitious. Specialty journals refer to the region’s “geochemical patterns”—only fragments of which are available to them to analyze for “the characteristics, signatures, and genesis of Nevada’s world-class gold systems”—the idea being that these might be found again elsewhere and thus be more instantly recognizable. Geologists track concentrations, contours, “metal zones,” and mineralized fractures; they build models of “stacked geochemical anomalies” in the earth below, hoping to piece together an accurate model of the gold ore’s location.

[Image: “American Mine (Carlin, Nevada 8, 2007)” by David Maisel].

Where the gold came from in the first place is yet another interpretive preoccupation. A paper—forthrightly titled “Is the Ancestral Yellowstone Hotspot Responsible for the Tertiary ‘Carlin’ Mineralization in the Great Basin of Nevada?”—suggests that the gold of the Carlin Trend is actually a thermal after-effect, or geochemical ghost, of the still-nomadic Yellowstone hotspot that once pulsed and geysered beneath Nevada.

The language used to describe these deposits is often extraordinary. We read, for instance, that discontinuous ore bodies apparently produced at different “stages of mineralization” in the earth’s history might, in fact, be “part of a single event that evolved chemically through time.” That is, one state-sized geological event—with titanic embryos merging and splitting inside the earth—delicately infused into the landscape from below as slow pulses of mineral-rich magmatic fluid freeze into spidery veins of precious metal. Or we read about “anomaly-related mineral assemblages,” millions of years’ worth of “mineralizing events,” and “geochemical halos in this part of the Carlin Trend.” Industrial descriptions of the earth’s interior lend an unexpected poetry to the act of mining.

Another way of saying all this is that mind-bogglingly large terrestrial events, occurring invisibly below ground in rock formations we can only measure indirectly—scanning the earth for hidden signatures—produce ore bodies, the excavation, dismemberment, and eventual global distribution of which shapes human economic history in turn.

[Image: “American Mine (Carlin, Nevada 10, 2007)” by David Maisel].

In any case, the form of a gold deposit itself must be mapped and clarified before excavation can begin. The shape of the ensuing pit is not the result of frantic, directionless digging, but of a carefully controlled design process. The word “design” is used deliberately here, even if the shape of the pit is orchestrated not by aesthetics but by the needs of financial rationality. Using proprietary graphics software—similar in function to visual effects programs used in film, gaming, and architecture—the ore body is predictively 3D-modeled.

Mining, at this point, becomes less an act of extraction than of physical verification: machines and their profit-minded operators pursue the outlines of a virtual form by gradually expanding the mine’s target zones, in effect checking to see if the geologists’ models were right.

As architect Liam Young suggested in a recent interview, conducted after he returned from leading a group of design students on a research trip to the gold mines of Western Australia,

mining engineers are basically designers. They develop all these fragmentary data into models, which become the design of the pit itself. … But then what happens is, based on gold prices, the pit model changes. In other words, if the gold price or the mineral price is higher, then the pit gets wider as it becomes cost-effective to mine areas of lower concentration. This happens nearly in real time—the speed of the machines digging the pit can change over the course of the day based on the price of gold, so the geometry of the pit is utterly parametric, modeling these distant financial calculations.

In essence, Young suggests, mining engineers produce and explore speculative models of gold distribution in the rocks below ground. Using surprisingly low-res data taken from seismic tests and weighing that data against equipment availability, labor costs, and, most importantly, the internationally recognized price of gold, the extraordinary ballet of machines can begin.

This then becomes predictive on a much larger scale, as well. By constantly refining their models of how exactly gold forms in the first place, and where and how it can be mined most effectively, geologists can understand where—and, to some extent, predict when—future ore bodies might accumulate. Interestingly, these future deposits will appear on a timescale that far exceeds human civilization—so, while human miners most likely won’t be around to exploit them, it’s nonetheless intriguing to know that serpent-like veins of precious metal are incubating in the darkness beneath us.

[Images: (top) “American Mine (Carlin, Nevada 12, 2007)“; (bottom) “American Mine (Carlin, Nevada 13, 2007),” by David Maisel].

Here we return to Seabrook, who warns that “there is a good deal of poetry in these figures,” of ounces mined and subterranean veins discovered. “They are based on statistical models, a kind of three-dimensional game of connect the dots played by a computer.”

These are then treated explicitly and formally as works of art: Seabrook points out “a computer-generated three-dimensional picture of the ore body, dry-mounted and framed,” hanging on a geologist’s office wall. Call it the new Subterranean Romantic:

Mining people have a habit of stretching the metaphor when they talk about their ore bodies. They say how beautiful, how satisfying, how tantalizing their ore body is, they make hourglass shapes with their hands, knead with their fingers, smooth with their palms as they talk.

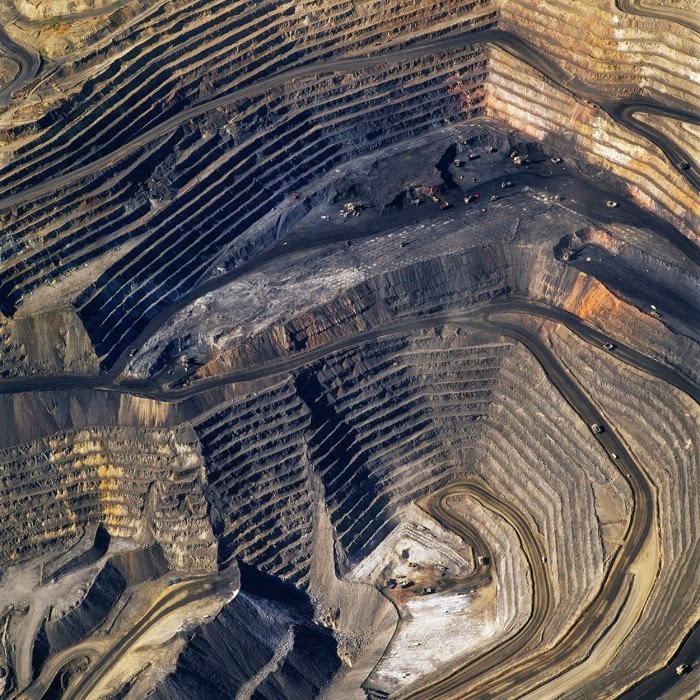
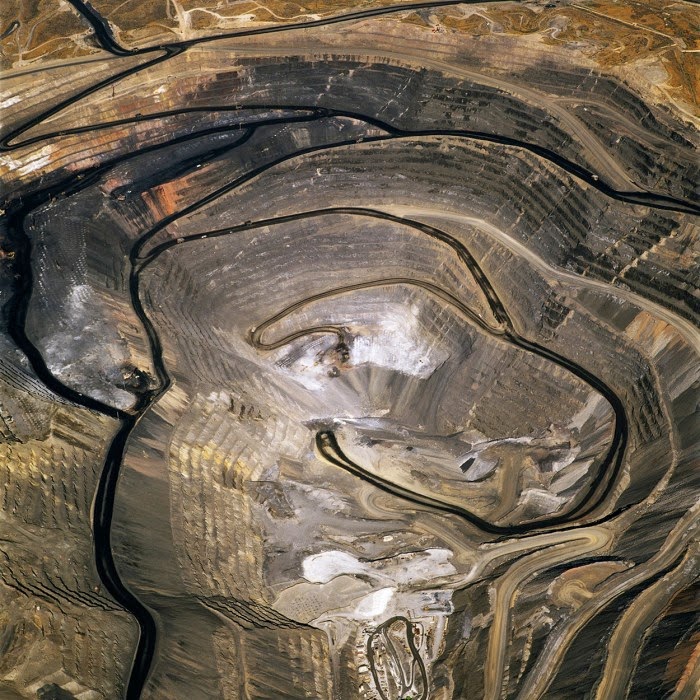
These gorgeous bodies, removed from the earth, leave scars: precisely designed but roughly implemented holes—exit wounds of temporally contingent value—clearly and deliriously visible from above.

[Images: “American Mine (Carlin, Nevada 12, 2007)” by David Maisel].

3.
The very idea that gold has value is a funny thing. Aside from a few basic industrial uses, gold’s value is almost entirely ornamental—that is, it is agreed upon by financial traders and metals futures markets, even if no actual gold changes hands. Gold comes out of one, very carefully designed hole in the ground—whether in Nevada, South Africa, or Western Australia—only, most likely, to be interred again in another part of the world in a bank vault or federal reserve, where it is precisely gold’s removal from direct exchange that augments its value and its mystery.

Mystery is not used lightly. In his odd but insightful study of the various symbolic entanglements between gold, cocaine, violence, and colonial labor in South America, anthropologist Michael Taussig writes, with suitably mythic overtones: “How perfect is gold, the great shape-changer, the liquid metal, the formless form.”

This “formless form,” however, undergoes a strange—we might say alchemical—transformation, from shining metal to the rarefied super-object known as money. In a long description based on a memoir by Captain Amasa Delano, Taussig recounts the nineteenth-century process of minting coins from gold bullion:

The gold ore was wetted and kneaded by blacks treading on it with their feet on a paved brick surface after which they put mercury on it so as to separate out the gold. Then the metal was heated, becoming red as blood. To get the liquid metal to run from its crucible, the spout was touched with a stick with a piece of cloth around it. When this stick made contact, there was a flash and the metal began to run in a stream not much thicker than a pipe stem. The bars of gold formed were subsequently squeezed flat by rollers until the thickness of a dollar or doubloon, by which time the bars had become sheets four feet long. A powerful press cut coins out from these thin sheets like a cookie cutter, and the pieces were turned to receive a milled edge. Then came the weighing.

For Taussig, this process reveals the machinations “both mysterious and everyday” by which a mineral becomes money—that is, how “gold and silver coins become enchanted, material things, aglow with a power emanating from deep within.” This base matter has been transformed, given exchange-value through formal regularity and sent off to participate in a global system of monetary transactions.

Gold coins are thus but one of the “minutiae in which the supernatural is secularized”: a haunted mineral is pulled from the earth and given an uncanny second life elsewhere.

[Image: “American Mine (Carlin, Nevada 22, 2007)” by David Maisel].

The spectral mathematics that can turn reserves of gold into abstract instruments of monetary exchange—into financial products and debt instruments, derivatives and funds—operates through a barely comprehensible carnival of surrogates flashing back and forth through the global marketplace. Until the end of the Bretton Woods system in August 1971, when the US dollar was unilaterally decoupled from the international gold standard, gold served as a reliable, universally recognized equivalent for economic exchange.

Gold, in the words of Jean-Joseph Goux, himself citing Marx, had value precisely because it could so effectively disappear into the “circulation of substitutes.” This is a logic of exchange by which Object A can be traded for Object B, as long as we agree that Object B also refers, off-stage, to something else entirely: some standard or reserve for which it acts as a practical surrogate.

Before 1971, that off-stage presence—that silent original, sleeping in a state of eternal reservation—was gold.

[Image: “American Mine (Carlin, Nevada 20, 2007)” by David Maisel].

To say, then, that there is an “economy” is thus to use shorthand for what Goux describes as “a regulated process of equivalents and substitutions,” whereby stand-ins, equivalents, and acceptable replacements all interact in occulted reference to an absentee original. The natural hard matter of gold, artificially extracted from the earth, thus becomes caught up in a supernatural system of objects: coins, bills, and derivatives—future duplicates and doubles.

In this context, the ongoing attempts to return the United States to the gold standard—by, for instance, perennial Republican presidential candidate Ron Paul—can be seen as an almost folkloristic attempt to put the genie of infinite derivative exchange back in the bottle.

Sites like Nevada’s Carlin Trend thus serve as base points for this process, emitting endless phantasms in an economic fiction of equivalents—derivative products that refer to one another in a superstition of indirect exchange referred to as the economy—to such an extent that we might say these mines can never be refilled. Or, more accurately, they can only be overfilled, stuffed beyond capacity with the carnival of substitutes their hollowing-out has, however inadvertently, unleashed.

[Image: “American Mine (Carlin, Nevada 7, 2007)” by David Maisel].

4.
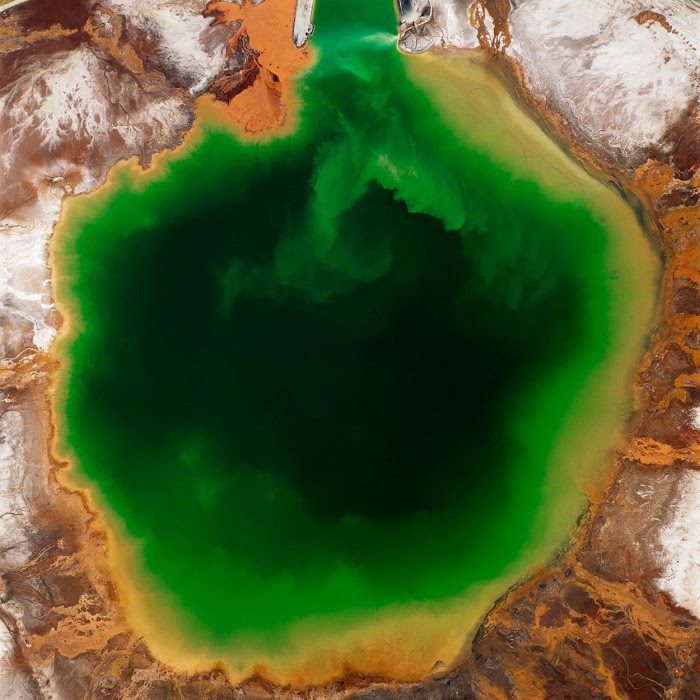
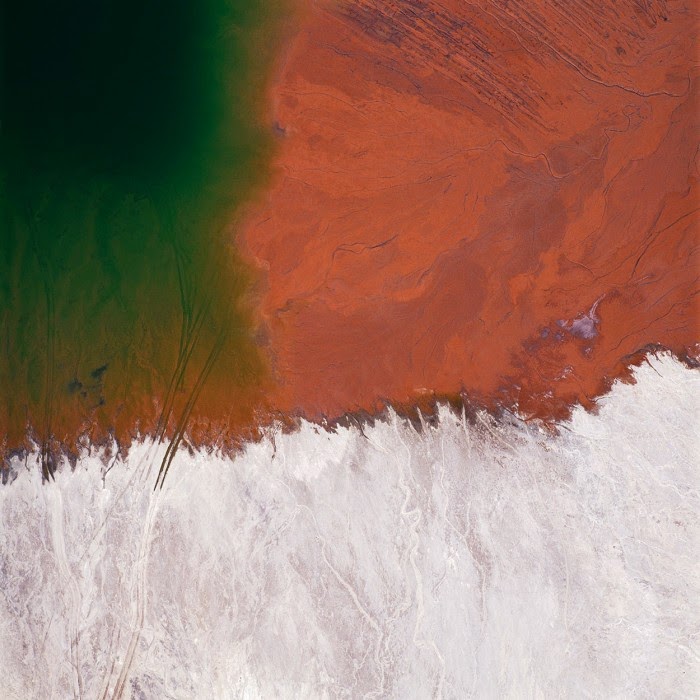
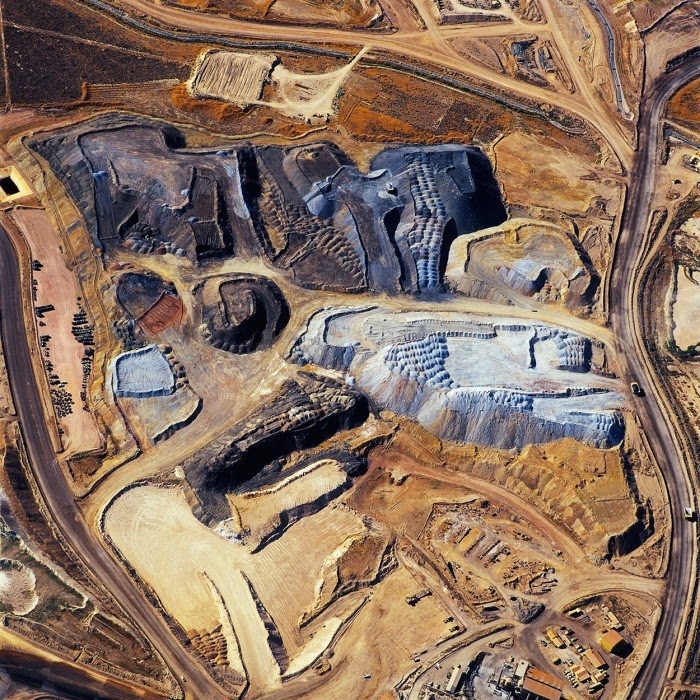
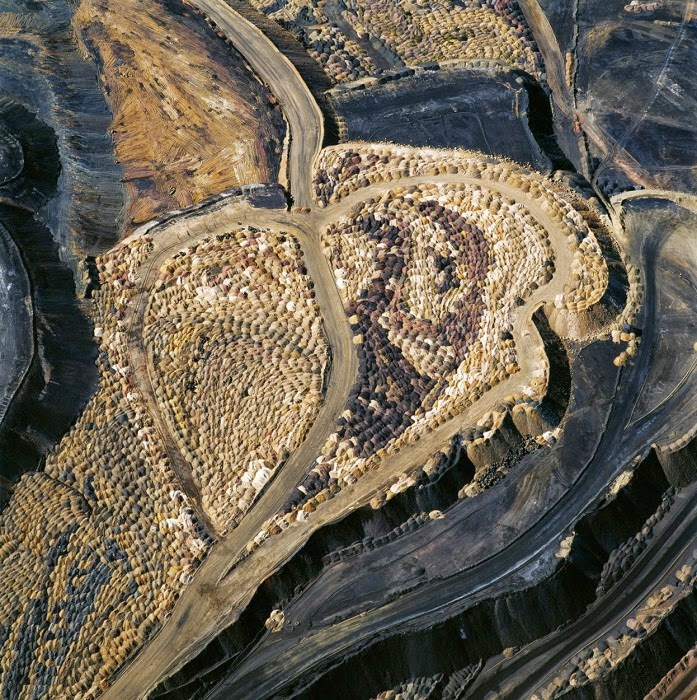
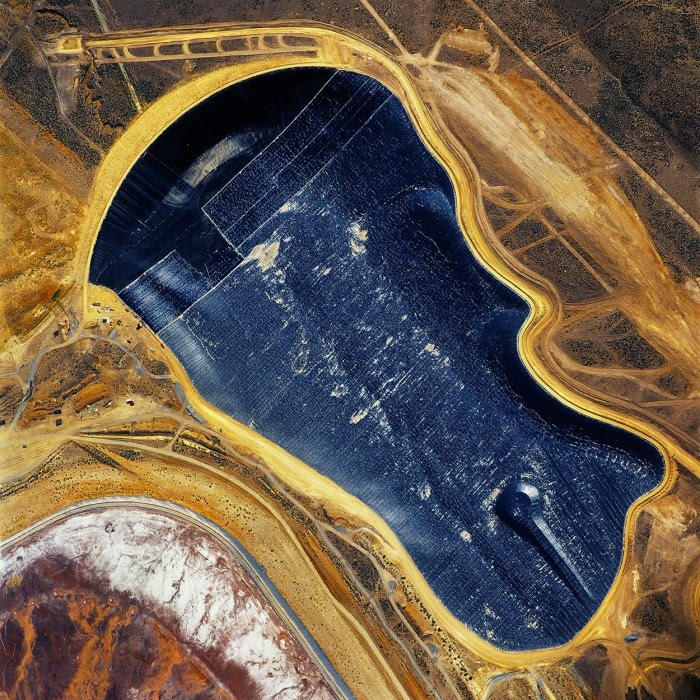
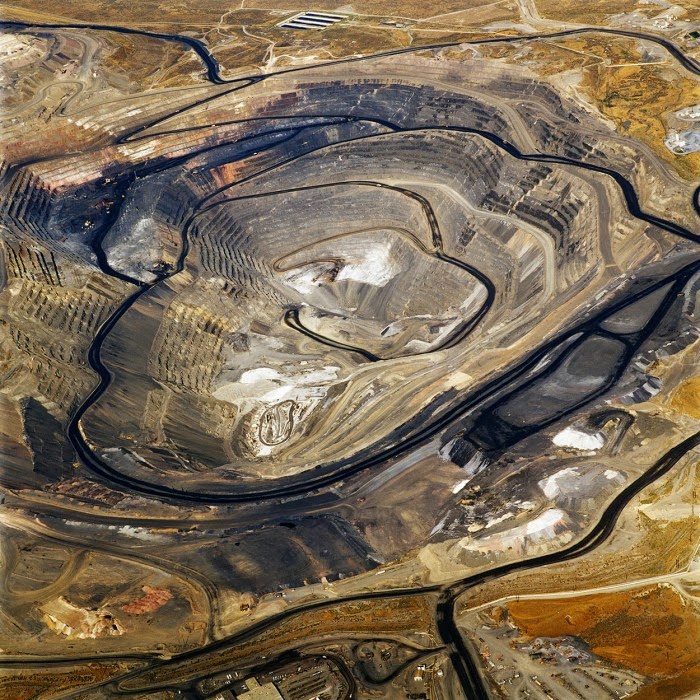
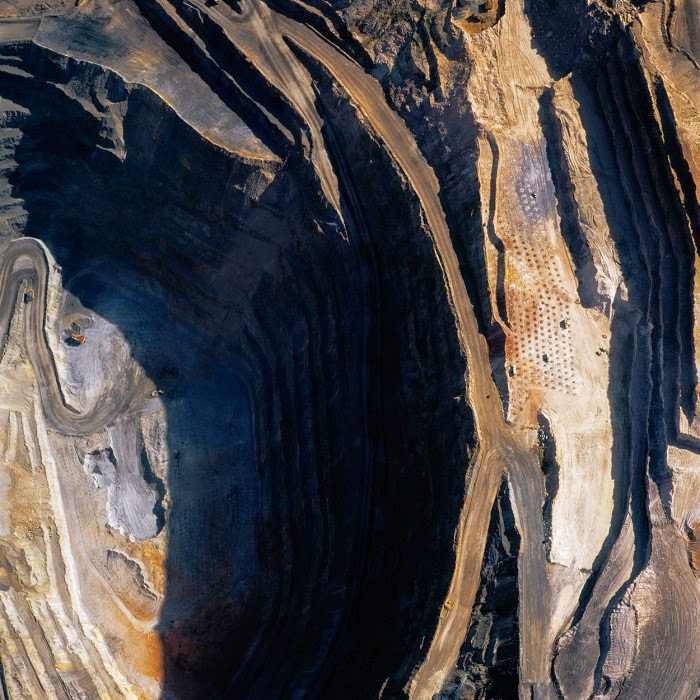
In 2007, David Maisel began work on a group of photographs called “American Mine,” part of a larger and older series known as “The Mining Project.” These images document, in extraordinary abstract swaths of color, the emergent geometries of mines along the Carlin Trend.

Scattered across Maisel’s images is a forensic survey of cuts and incisions—wounds that will outlive us, scars that won’t go away—older surgeries through which modernity has, in effect, been created. The mines of the Carlin Trend remain unhealed—in fact, year on year, they are growing—a raw scurvy of rocks exposed on a scale so monumental that geologists estimate mines, not cities, will be the final trace of humanity left visible in a hundred million years’ time.

[Image: “American Mine (Carlin, Nevada 17, 2007)” by David Maisel].

Vast terraced bowls step down—and down and, impossibly, further down—tracking dead faults and mineralization fronts on a scale only made clear when we notice 16-ton trucks like specks of dust on canyon walls. Discolored oceans of chemical runoff wash across vehicle tracks with acid tides. Retaining walls and stabilized slopes loom over assembled superscapes of mine detritus, abandoned shells of industrial insects dwarfed by the world they’ve helped create.

In these scenes, geotextile mats have all but replaced the earth’s surface, offering instead a deathless, replicant topography. Artificial hills, each uncannily and exactly like its neighbor, roll from one side of the frame to the other, shifting in tandem with commodities prices, their malleable geography thus forever resistant to mapping. The mines grow and metastasize as voids: storm fronts of negative space exploding with their own slow thunder into the planet.

[Image: “American Mine (Carlin, Nevada 14, 2007)” by David Maisel].

What is of particular interest in Maisel’s “American Mine” series is its revelation of the injuries at the start of the commodity chain: planetary wounds, seemingly beyond the breadth of nature, out of which commodities have been extracted for later exchange.

The production of economically recognizable objects can thus be seen as a kind of terrestrial focusing: out of the chaos of the mine site, with great lakes clouded by geochemical effluent and abstract landforms like ritual mounds from human prehistory, pristine products eventually emerge, assembled from these heavy elements torn so roughly from the ground. Out of the carcinogenic discord of rock dust, circuit boards appear.

In a sense, it is surprising that the computers, phones, batteries, television sets, and other mundane electronics that fill the markets of the world are so free of this fallout, so astringently cleansed of the geological evidence of their own creation. Or perhaps we might say that it is precisely this stripping-away of a product’s elemental birth that gives it its later value and utility. Such products are ironically de-terrestrialized: washed of the very planet from which they came.

• • • 

I owe a huge thank you to David Maisel and editor Alan Rapp for inviting me to participate in the Black Maps book, which is an absolutely gorgeous compendium of Maisel’s work, as well as to Sina Najafi for his editorial feedback before this essay ran in Cabinet Magazine. You can see some photos of Black Maps over at the publisher’s website.

For those of you in Los Angeles, meanwhile, Maisel has a new show opening this spring—on March 26th, 2015—at the Mark Moore Gallery. Check back at this link in the weeks to come for more information.

Finally, if you would like to read some previous posts here on BLDGBLOG about Maisel’s work, don’t miss “The Fall” or “Library of Dust,” among many other short posts; and be sure to read the interview with David Maisel published in The BLDGBLOG Book.

The Moving Mountain, or Terrain as Spectacle

[Image: Courtesy of the Los Angeles Times Photographic Archive, Department of Special Collections, Charles E. Young Research Library, UCLA, via KCET].

Nathan Masters remains one of the more interesting chroniclers of life and landscape in Southern California, as evidenced by his “L.A. as Subject” blog for KCET. I could (and should) just link to all his posts, to be honest—lost hills! buried rivers! conflicting grids!—but last week’s installment, albeit short, was particularly interesting.

“For a few days in late November 1937,” Masters writes, “it was the Southland’s greatest attraction—a landslide in slow motion, 1.5 million tons of an Elysian Park hillside creeping toward the Los Angeles River bed.”

Sensational news reports, printed in papers and broadcast on radio nationwide, described it as a “moving mountain,” and tourists came from afar to witness the geologic curiosity. One Oklahoma City police officer took a leave of absence to watch the slide. Two boys hopped freight trains from New York to see it. Some 10,000 sightseers came by the hour. Spectators pressed against police barricades along Riverside Drive, and enterprising vendors worked the throng like a baseball game, hawking peanuts, popcorn, and soda. Some even sold field glasses.

Even local astronomers showed up, telescopes in tow, in order to study the mobile mass, this blob of geology suddenly making a move into town.

After a catastrophic lurching of the slow-motion mountain, the terrain appeared to come to a standstill. “The next day, an estimated crowd of 500,000 converged on the site, munching on popcorn and hoping the mountain would move again.”

This pent-up dramaturgy of the landscape—the possibility that its newfound agency would continue—crawling, oozing, rolling, forcing its way into public consciousness—remains strong today, even if subsumed into other contexts.

In other words, I’d suggest that many Angelenos are still, in a sense, “munching on popcorn and hoping the [landscape] would move again,” and that this is the dark fascination of seismic instability, of what it means to live in an earthquake zone: that the land itself is active, motivated from within by a kind of a slow-motion sentience, a mineral energy that is as much an invigorating spectacle as it is an existential threat.

Read the rest of Masters’s post over at “L.A. as Subject.”

A Cenotaph for Tailings

[Image: From “Mining Cenotaph” by Alexis Quinteros Salazar; courtesy of the RIBA President’s Medals].

Here’s another project from the RIBA President’s Medals, this one by Alexis Quinteros Salazar, a student at the University of Chile in Santiago.

Called “Mining Cenotaph,” it imagines an “occupation” of the tailings piles that have become a toxic urban landmark and a spatial reminder of the region’s economic exploitation.

[Image: From “Mining Cenotaph” by Alexis Quinteros Salazar; courtesy of the RIBA President’s Medals].

A museum would be carved into the tailings; in Salazar’s words, this would be a “building that captures the history and symbolism behind mining, enhancing and revitalizing a memory that is currently disaggregated and ignored and has a very high touristic potential.”

[Image: From “Mining Cenotaph” by Alexis Quinteros Salazar; courtesy of the RIBA President’s Medals].

In an architectural context such as this, the use of the word “cenotaph” is a pretty clear reference to Étienne-Louis Boullée’s classic speculative project, the “Cenotaph for Newton.” Over multiple generations, that has become something of a prime mover in the history of experimental architectural design.

Punctured walls and ceilings bring light into the interior—

[Image: From “Mining Cenotaph” by Alexis Quinteros Salazar; courtesy of the RIBA President’s Medals].

—while the roof is a recreational space for visitors.

Of course, there are a lot of unanswered questions here—including the control of aerosol pollution from the tailings pile itself and that pile’s own long-term structural stability—but the poetic gesture of a public museum grafted into a pile of waste material is worth commending.

[Image: From “Mining Cenotaph” by Alexis Quinteros Salazar; courtesy of the RIBA President’s Medals].

The detail I might like this most is where the structure becomes a kind of inversion of Boullée’s dome, which was pierced to make its huge interior space appear illuminated from above by constellations. Here, instead, it is the perforations in the the rooftop that would glow upward from below, as if in resonance with the night skies high above.

[Image: From “Mining Cenotaph” by Alexis Quinteros Salazar; courtesy of the RIBA President’s Medals].

Salazar’s project brings to mind a few other proposals seen here over the years, including the extraordinary “Memorial to a Buried Village” by Bo Li and Ge Men, as well as Brandon Mosley’s “Mine Plug” (which actually took its name retroactively from that BLDGBLOG post).

Click through to see slightly larger versions of the images over at the RIBA President’s Medals website.

[Image: From “Mining Cenotaph” by Alexis Quinteros Salazar; courtesy of the RIBA President’s Medals].

Finally, don’t miss the Brooklyn food co-op posted earlier, also a recent President’s Medal featured project.

Touchscreen Landscapes

[Image: Screen grab via military.com].

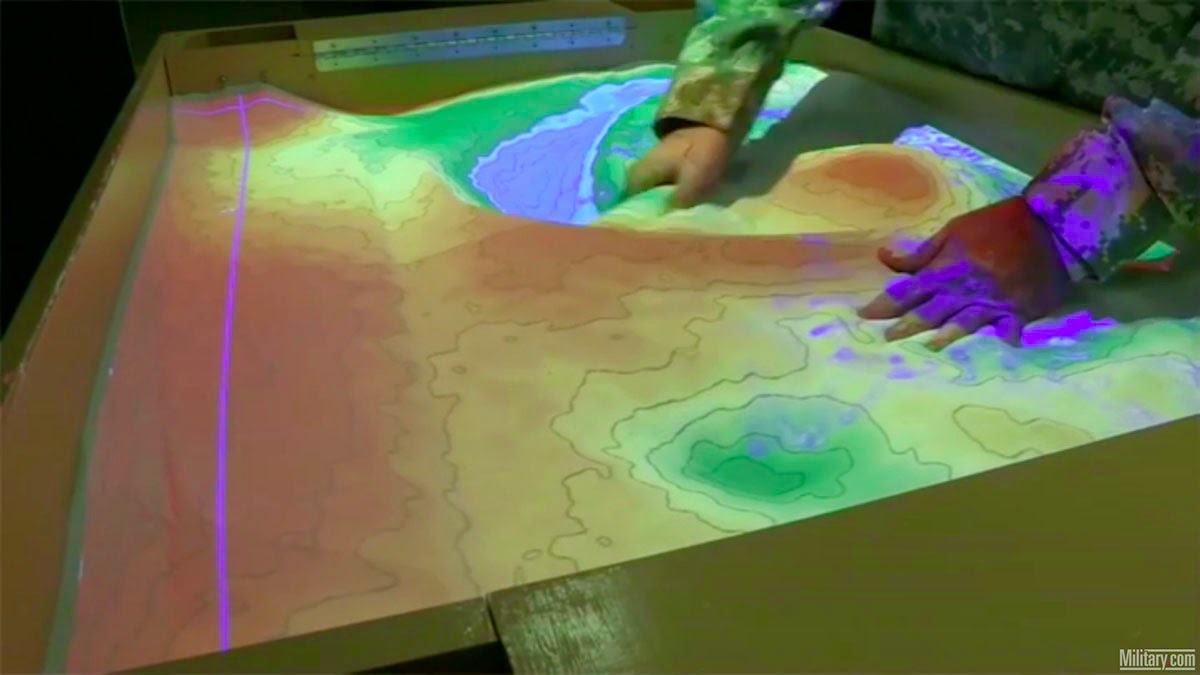
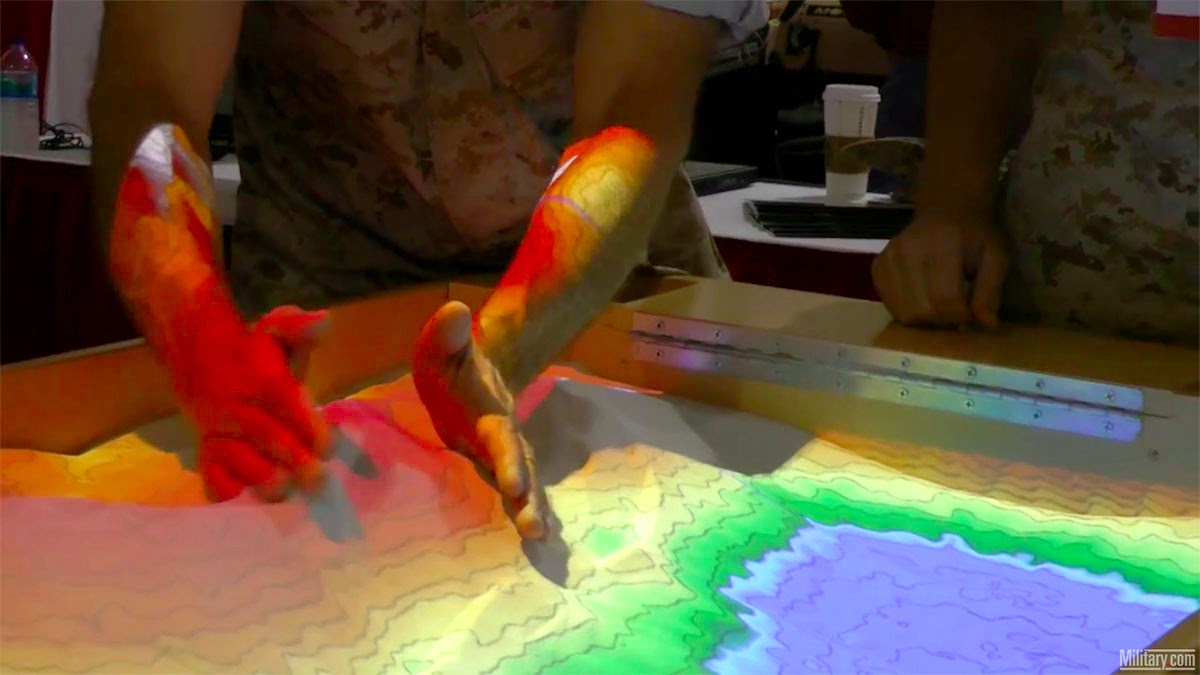
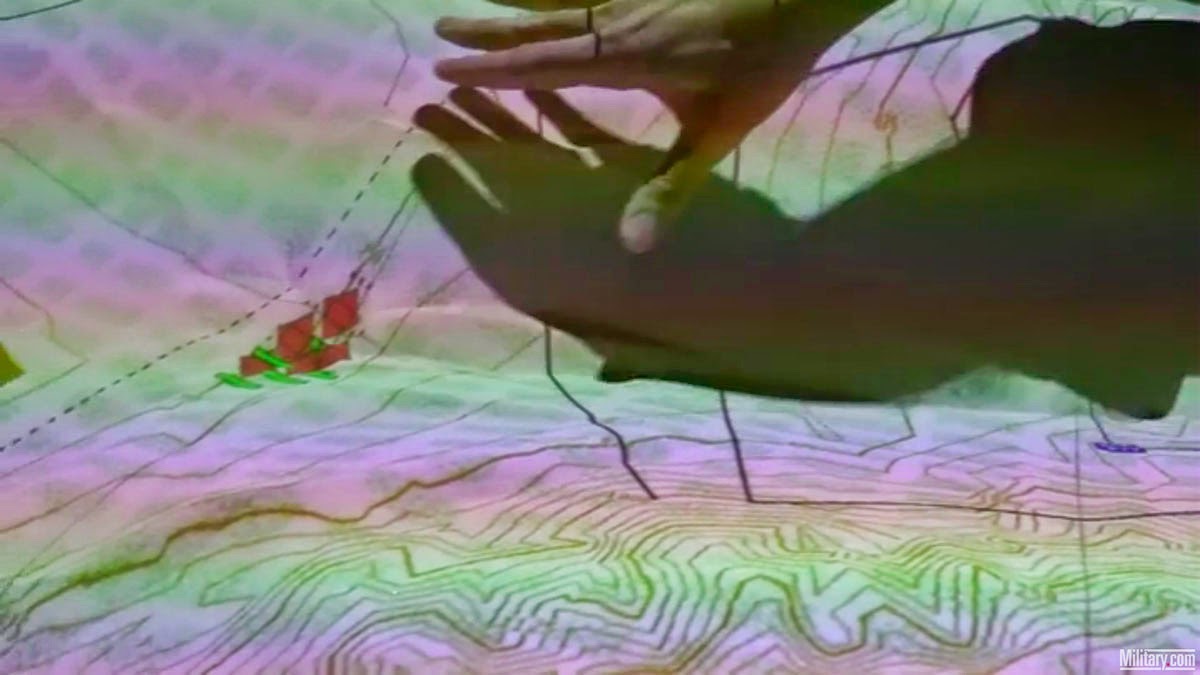
This new, partly digital sand table interface developed for military planning would seem to have some pretty awesome uses in an architecture or landscape design studio.

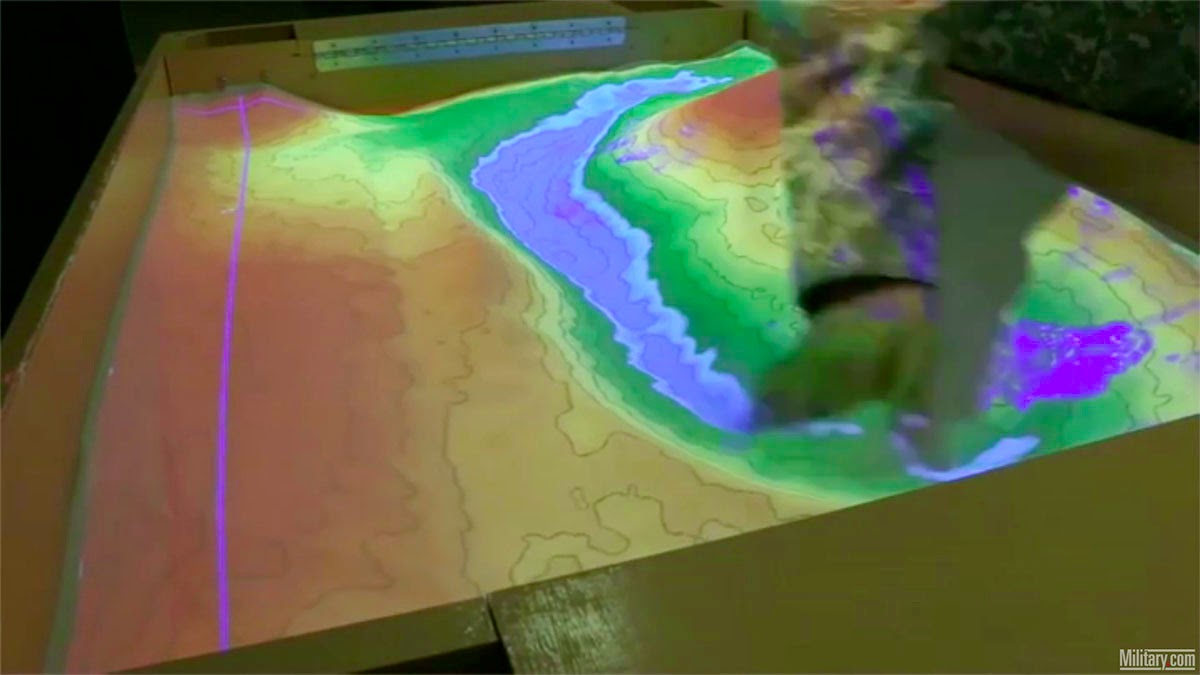
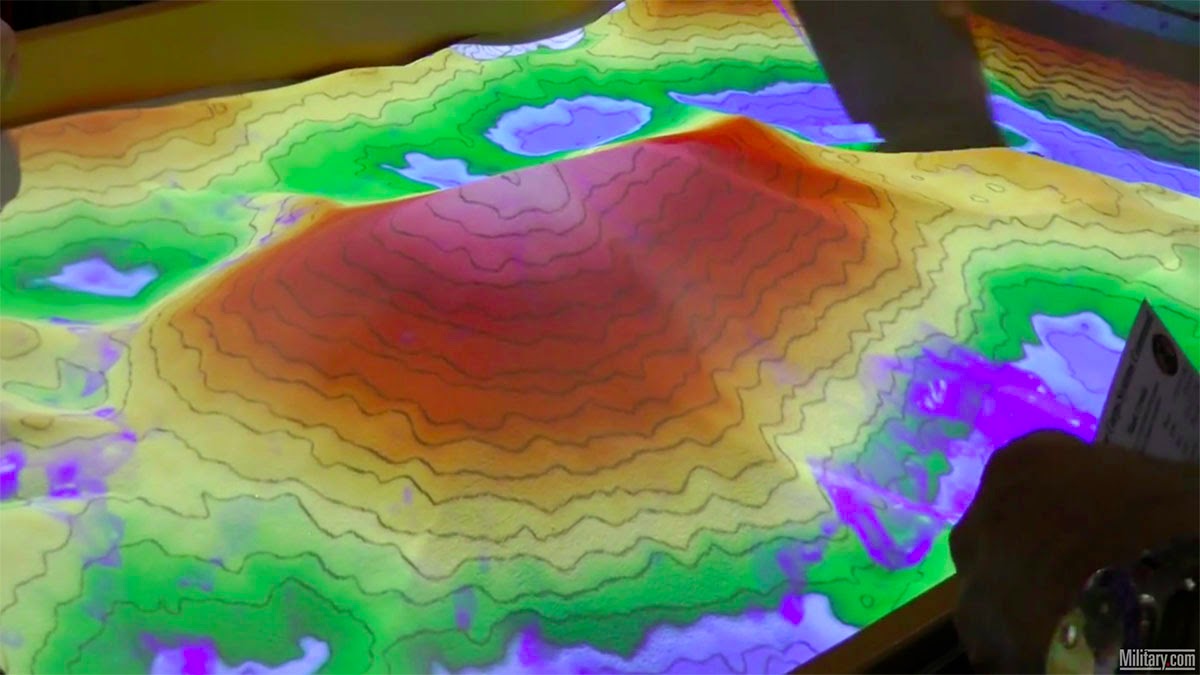
Using 3D terrain data—in the military’s case, gathered in real-time from its planetary network of satellites—and a repurposed Kinect sensor, the system can adapt to hand-sculpted transformations in the sand by projecting new landforms and elevations down onto those newly molded forms.

You can thus carve a river in real-time through the center of the sandbox, and watch as projected water flows in—

[Image: Screen grabs via military.com].

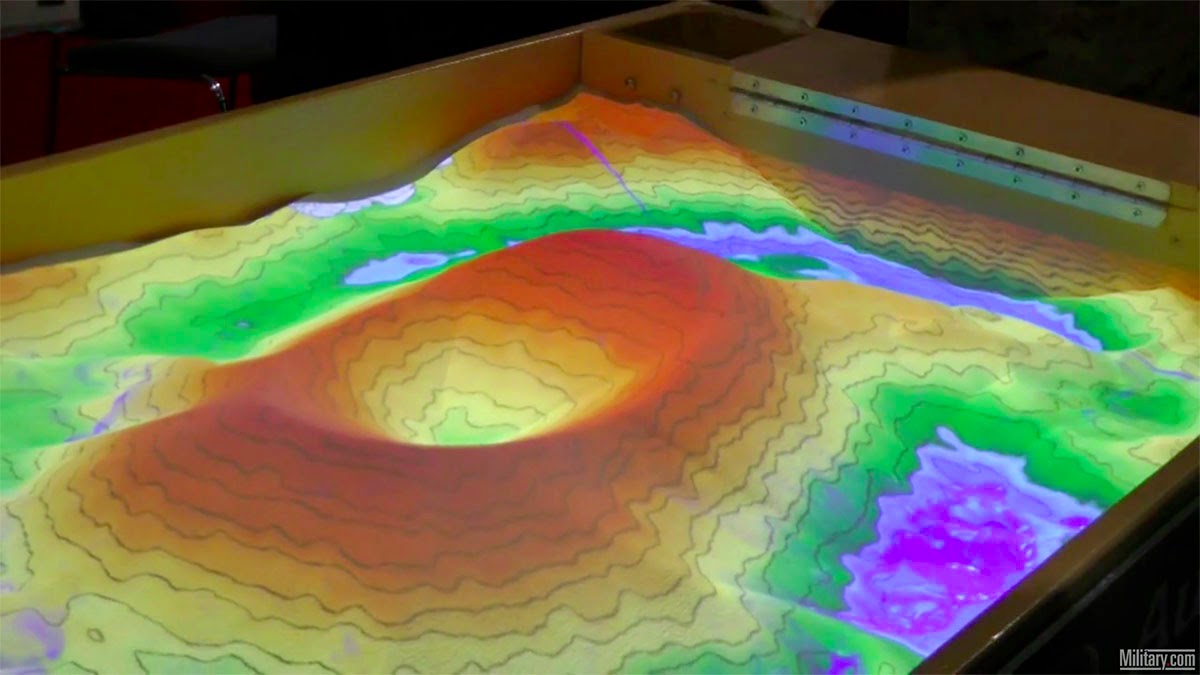
—or you can simply squeeze sand together into new hills, and even make a volcanic crater.

[Image: Screen grabs via military.com].

The idea of projecting adaptive landscape imagery down onto a sandbox is brilliant; being able to interact with both the imagery and the sand itself by way of a Kinect sensor is simply awesome.

Imagine scaling this thing up to the size of a children’s playground, and you’d never see your kids again, lost in a hypnotic topography of Minecraft-like possibilities, or just donate some of these things to a landscape design department and lose several hours (weeks?) of your life, staring ahead in a state of geomorphic Zen at this touchscreen landscape of rolling hills and valleys, with its readymade rivers and a thousand on-demand plateaus.

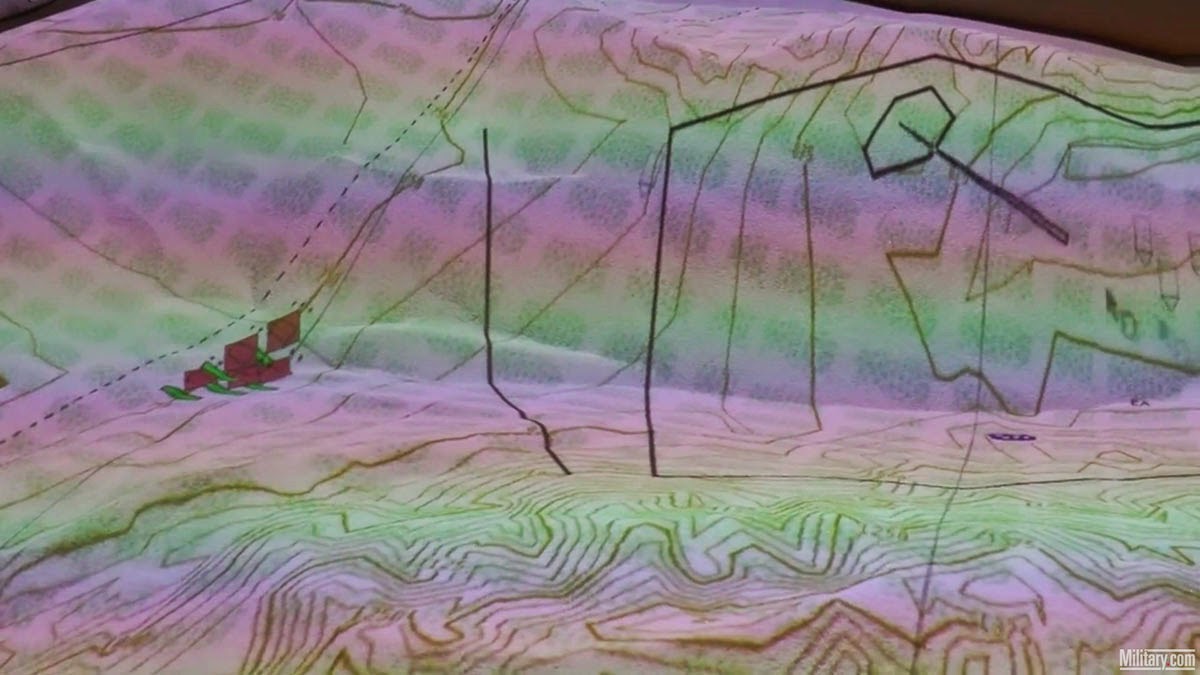
The military, of course, uses it to track and kill people, filling their sandbox with projections of targeting coordinates and geometric representations of tanks.

[Image: Screen grabs via military.com].

But there’s no reason those coordinates couldn’t instead be the outlines of a chosen site for your proposed architecture project, or why those little clusters of trucks and hidden snipers couldn’t instead be models of new buildings or parks you’re hoping will be constructed.

Watch the original video for more.

NATO’s Underground Roman Super-Quarry

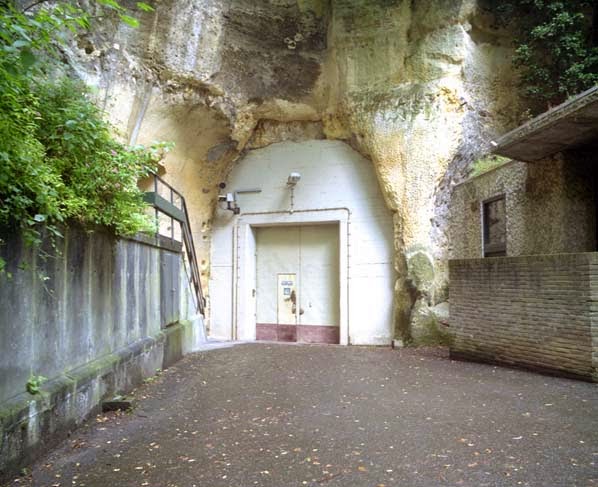
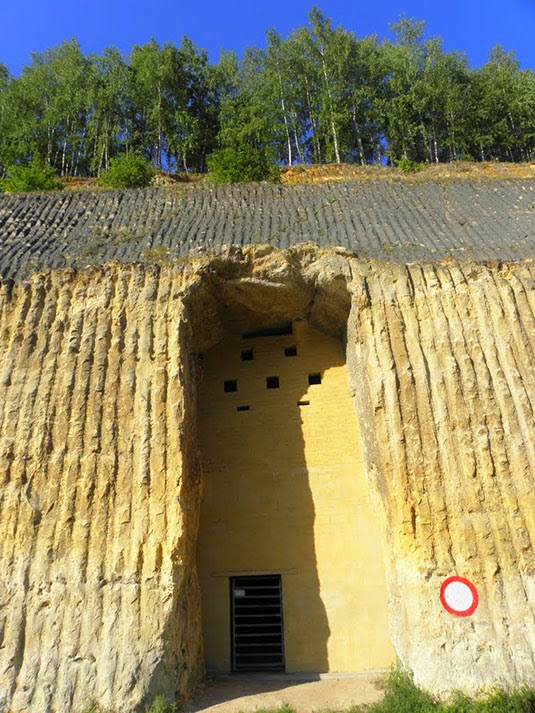
[Image: An entrance to the quarry in Kanne; photo by Nick Catford via Subterranean Britannica].

There is an underground Roman-era quarry in The Netherlands that, when you exit, you will find that you have crossed an invisible international border somewhere down there in the darkness, and that you are now stepping out into Belgium; or perhaps it’s the other way around, that there is an underground Roman-era quarry in Belgium that, when you exit, you will find that you have crossed an invisible international border somewhere down there in the darkness, and that you are now stepping out into The Netherlands.

However, this is not just a disused quarry—not just an archaeological site on the fringes of the Roman empire that was once mined for blocks of limestone. Its afterlife is by far the most interesting part of the story.

For nearly a century, beginning in the 1800s, these underground hollows were used by Jesuit monks as a secluded place for prayer, study, and meditation, and even for the carving of elaborate and impressive forms into the soft rock walls; then the Nazis took over, transforming this weird underworld into a subterranean factory for World War II airplane parts; then, finally, pushing the stakes yet higher, the whole complex of former Roman limestone mines, straddling an international border underground between two modern European nations, was turned into a doomsday bunker for NATO, a dark and mold-prone labyrinth within which military commanders constructed a Joint Operations Center for responding to the end of the world (whenever the time finally came).

[Images: Monks underground; via De Limburgse Mergelgrotten].

“There was even a 3-hole golf course complete with artificial turf,” Subterranean Britannica reports in a recent issue of their excellent magazine, Subterranea.

“The complex was on average 50 meters below ground covering an area of approximately 6750 acres with eight miles of corridors, 400 branches and 399 individual offices,” SubBrit explains. There were escape tunnels, as well, “one going out to the banks of the Albert Canal in Belgium, and one which came out in a farmer’s potato store in the village of Kanne.” It had its own water supply and even a dedicated wine cellar for NATO officers, who might need a glass of Europe’s finest chardonnay to help feel calm enough to launch those missiles.

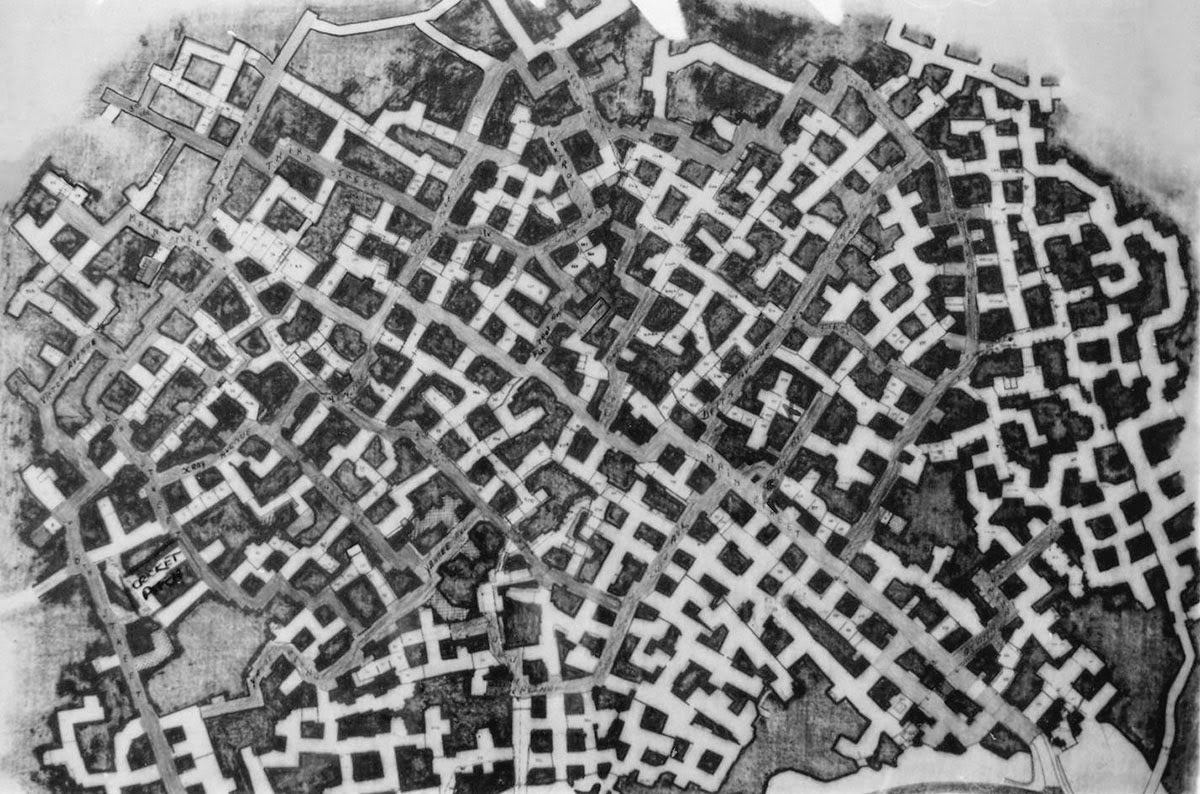
Just look at this thing’s mind-boggling floor plan.

The “streets” were named, but not always easy to follow; however, this didn’t stop officers stationed there from occasionally going out to explore the older tunnels at night. A former employee named Bob Hankinson describes how he used to navigate:
Most corners were roughly 90 degrees, but only roughly. Going through the caves was an exercise in left and right turns every 50 feet or so. Navigation was helped by street names. Unlike in the USA, where streets are numbered on a sort of grid pattern, these were zigzag streets. My office on Main Street and J Street, so if I got lost I would just keep walking until I came to either Main or J, and join it. If I went the wrong way, eventually the street would peter out either at the perimeter or a T-junction, and you would just turn round and go back the other way.

As another former employee—a man named Alan Francis—explains, “If I did have spare time, I would wander through the dark tunnels where there were very few lights on at night, thinking how strange it was to be working in a Roman stone quarry.”

Writing in Subterranea, SubBrit explains that “nothing ever came out.” This was “a strict rule: apart from people, anything that went in never came out. All waste material ranging from redundant furniture to foot waste was dumped in one of the sixteen underground landfill sites” designated within this sprawling whorl of rooms and passages. Shredded documents were even mixed with water and applied directly to the walls as a kind of fibrous paste, used for insulation.

Such was the secrecy surrounding this place that it was officially classified as “a ‘forbidden place’ under the Protection of State Secrets Act which forbade people to even talk about it.”

One reason why the underground galleries are so vast, meanwhile, is apparently because of the character of the limestone they were carved through; in fact, “the limestone was so soft that the workers used a chainsaw to cut it.”

The notion that I could just cut myself a whole new room with a chainsaw—just revving this thing up and carving an entire new hallway or corridor, pushing relentlessly forward into what looks like solid earth, possibly even sawing my way into the roots of another country—is so awesome an architectural condition that I would move there tomorrow if I could.

Just imagine building this titanic doorway into the earth with a small group of friends, a case of beer, and a few chainsaws. It’s like Cappadocia by way of the Cold War. By way of Husqvarna.

[Image: An entrance into the NATO complex; via this thread].

Sadly, the whole place is contaminated with asbestos and has been badly saturated with diesel fuel. At least one environmental analysis of the underground maze found that “diesel fuel from the [copious emergency fuel] tanks had leaked into the porous limestone over a long period and had penetrated to a depth of about forty feet into the rock.”

You can imagine the weird bonfires that could have resulted should someone have been stupid enough to light a match, but “this area had to be removed and disposed of,” we read—presumably by chainsaw.

Nonetheless, today you can actually take a tour of this place—this now-derelict doomsday logistics hub that straddles international borders underground—courtesy of the Limburg Landscape Foundation.

If you can take the tour, let me know how it goes; I’d love to visit this place in person someday and would be thrilled to see any photographs.

(If you like the sound of underground NATO quarries and want to see more, don’t miss these vaguely related photo sets: NATO Quarry, N.A.T.O. Quarry, N.A.T.O. Quarry, France, Urban Explorers Discover Corroding Military Vehicles in Abandoned Subterranean Bunker, and Nato Quarry, Paris Suburbs May 2011).

The Snow Mine

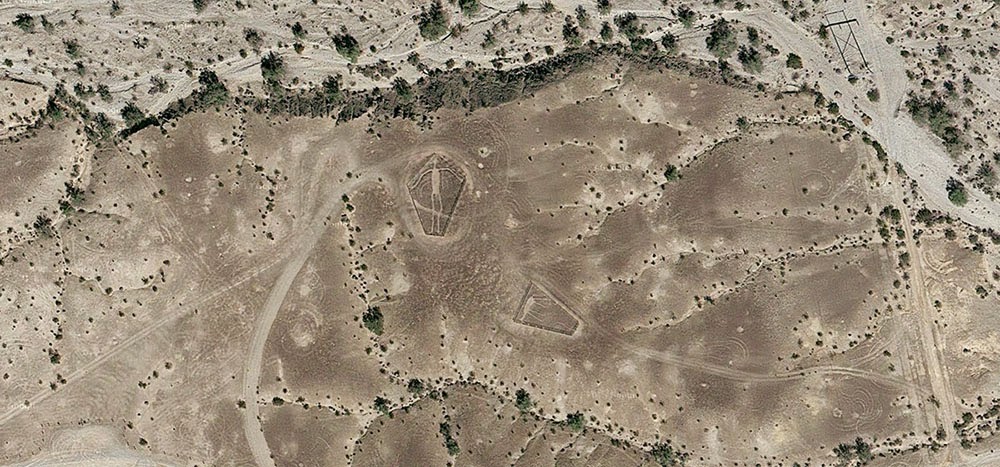
[Image: The “Blythe Intaglios,” via Google Maps].

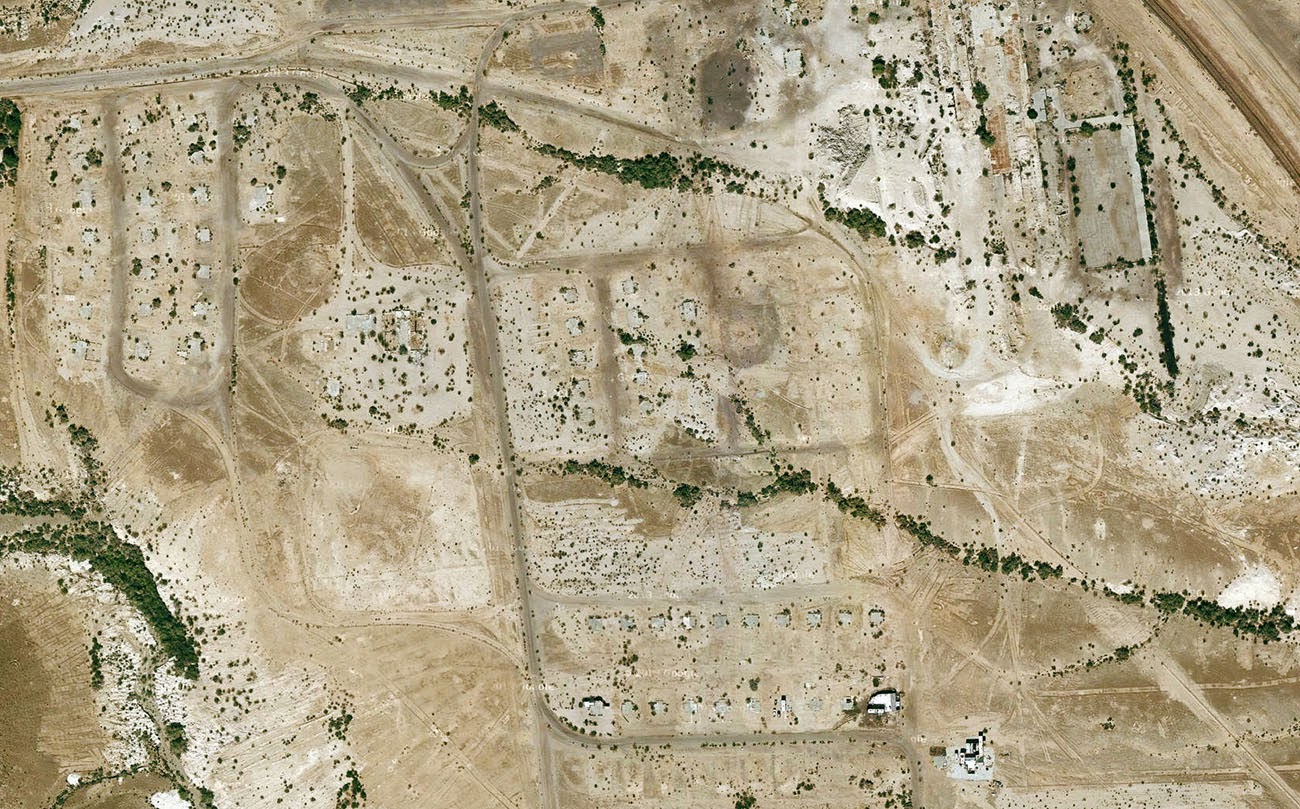
After reading an article about the “Blythe geoglyphs”—huge, 1,000-year old images carved into the California desert north of Blythe, near the border with Arizona—I got to looking around on Google Maps more or less at random and found what looked like a ghost town in the middle of nowhere, close to an old mine.

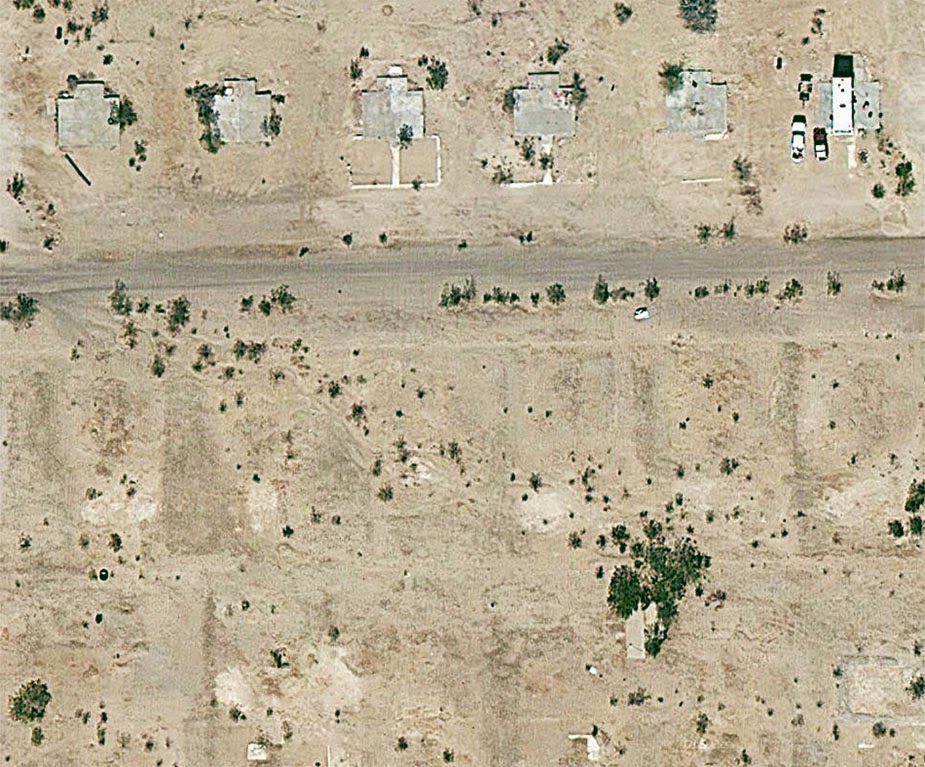
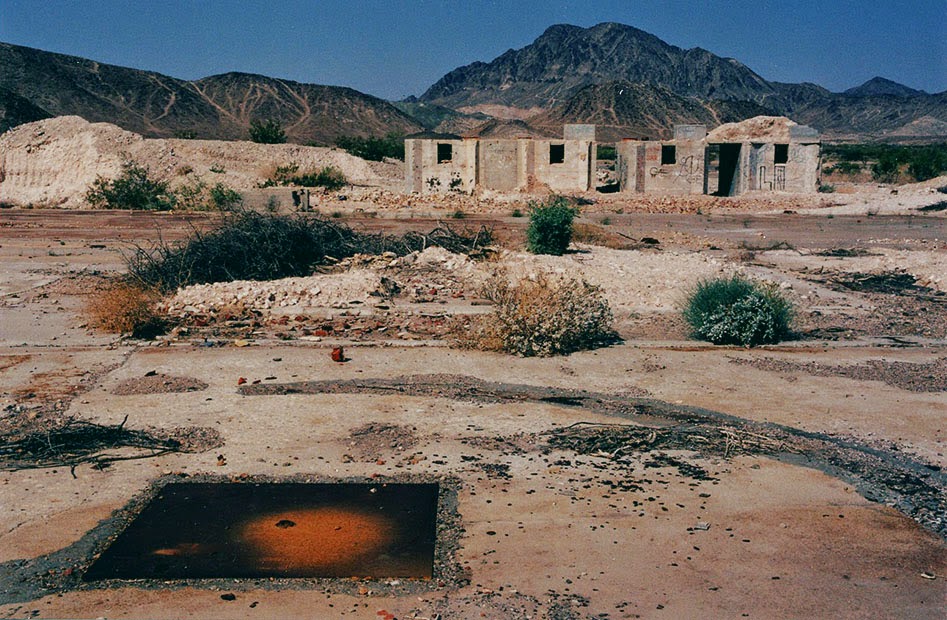
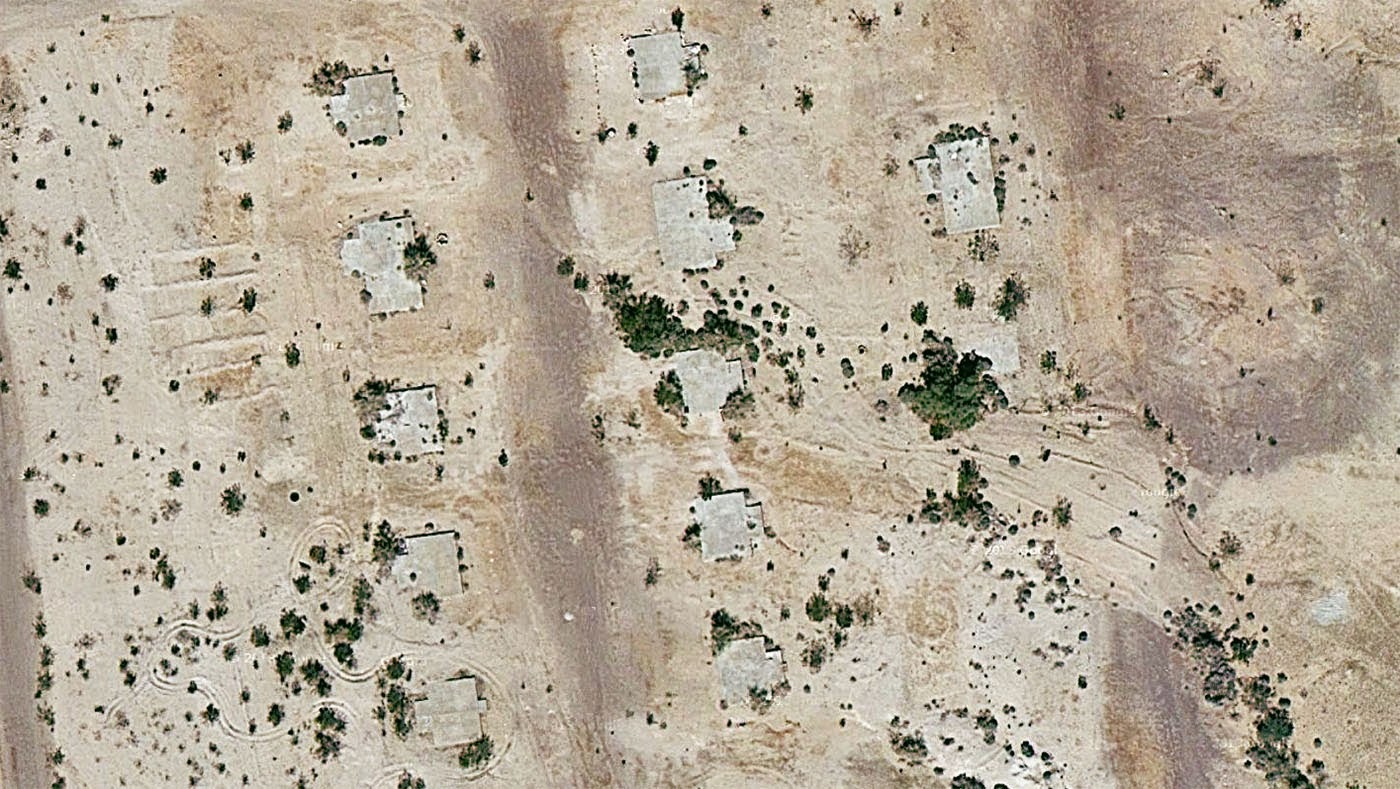
Turns out, it was the abandoned industrial settlement of Midland, California—and it’s been empty for nearly half a century, deliberately burned to the ground in 1966 when the nearby mine was closed.

[Image: Midland, California, via Google Maps].

What’s so interesting about this place—aside from the exposed concrete foundation pads now reused as platforms for RVs, or the empty streets forming an altogether different kind of geoglyph, or even the obvious ease with which one can get there, simply following the aptly named Midland Road northeast from Blythe—is the fact that the town was built for workers at the gypsum mine, and that the gypsum extracted from the ground in Midland was then used as artificial snow in many Hollywood productions.

[Image: Midland, California, via Google Maps].

As the L.A. Times reported back in 1970—warning its readers, “Don’t Go To Midland—It’s Gone”—the town served as the mineral origin for Hollywood’s simulated weather effects.

“Midland was started in 1925 as a tent city,” the paper explained, “with miners in the middle of the Mojave Desert digging gypsum out of the Little Marias to meet the demands of movie studios. All the winter scenes during the golden age of Hollywood were filmed with ‘snowflakes’ from Midland.”

[Image: The abandoned streets of Midland, former origin of Hollywood’s artificial snow; photo via CLUI].

Like some strange, artificial winter being mined from the earth and scattered all over the dreams of cinemagoers around the world, Midland’s mineral snow had all the right qualities without any of the perishability or cold.

See, for example, this patent for artificial snow, filed in 1927 and approved in 1930, in which it is explained how gypsum can be dissolved by a specific acid mix to produce light, fluffy flakes perfect for the purposes of winter simulation. Easy to produce, with no risk of melting.

[Image: Midland, California, via Google Maps].

I’ve long been fascinated by the artificial snow industry—the notion of an industrially controlled climate-on-demand, spraying out snowflakes as if from a 3D printer, is just amazing to me—as well as with the unearthly world of mines, caves, and all things underground, but I had not really ever imagined that these interests might somehow come together someday, wherein fake glaciers and peaceful drifts of pure white snow were actually something scraped out of the planet by the extraction industry.

As if suggesting the plot of a deranged, Dr. Seussian children’s book, the idea that winter is something we pull from a mine in the middle of the California desert and then scatter over the warm Mediterranean cities of the coast is perhaps all the evidence you need that life is always already more dreamlike than you had previously believed possible.

(Very vaguely related: See also BLDGBLOG’s earlier coverage of California City).

Welcome to the World of the Plastic Beach

[Image: The new plastic geology, photographed by Patricia Corcoran, via Science].

Incredibly, a “new type of rock cobbled together from plastic, volcanic rock, beach sand, seashells, and corals has begun forming on the shores of Hawaii,” Science reports.

This new rock type, referred to as a “plastiglomerate,” requires a significant heat-source in order to form, as plastiglomerates are, in effect, nothing but molten lumps of plastic mixed-in with ambient detritus. Hawaii with its coastal and marine volcanoes, offers a near-perfect formational landscape for this artificially inflected geology to emerge—however, Patricia Corcoran, one of the discoverers of these uncanny rocks, thinks we’ll likely find them “on coastlines across the world. Plastiglomerate is likely well distributed, it’s just never been noticed before now, she says.”

We’ve been surrounded by artificial geologies all along.

But is it really geology? Or is it just melted plastic messily assembled with local minerals? Well, it’s both, it seems, provided you look at it on different time-scales. After heavier chunks of plastiglomerate form, fusing with “denser materials, like rock and coral,” Science writes, “it sinks to the sea floor, and the chances it will become buried and preserved in the geologic record increase.” It can even form whole veins streaking through other rock deposits: “When the plastic melts, it cements rock fragments, sand, and shell debris together, or the plastic can flow into larger rocks and fill in cracks and bubbles,” we read.

It doesn’t seem like much of a stretch to suggest that our landfills are also acting like geologic ovens: baking huge deposits of plastiglomerate into existence, as the deep heat (and occasional fires) found inside landfills catalyzes the formation of this new rock type. Could deep excavations into the landfills of an earlier, pre-recycling era reveal whole boulders of this stuff? Perhaps.

The article goes on to refer to the work of geologist Jan Zalasiewicz, which is exactly where I would have taken this, as well. Zalasiewicz has written in great detail and very convincingly about the future possible fossilization of our industrial artifacts and the artificial materials that make them—including plastic itself, which, he suggests, might very well leave traces similar to those of fossilized leaves and skeletons.

In a great essay I had the pleasure of including in the recent book Landscape Futures, Zalasiewicz writes: “Plastics, which are made of long chains of subunits, might behave like some of the long-chain organic molecules in fossil plant twigs and branches, or the collagen in the fossilized skeletons of some marine invertebrates. These can be wonderfully well preserved, albeit blackened and carbonized as hydrogen, nitrogen and oxygen are driven off under the effect of subterranean heat and pressure.” Plastiglomerates could thus be seen as something like an intermediary stage in the long-term fossilization of plastic debris, a glimpse of the geology to come.

Ultimately, the idea that the stunning volcanic beaches of Hawaii are, in fact, more like an early version of tomorrow’s semi-plastic continents and tropical archipelagoes is both awesome and ironic: that an island chain known for its spectacular natural beauty would actually reveal the deeply artificial future of our planet in the form of these strange, easily missed objects washing around in the sand and coral of a gorgeous beach.

(Spotted via Rob Holmes. Vaguely related: War Sand).

Demolition Ground


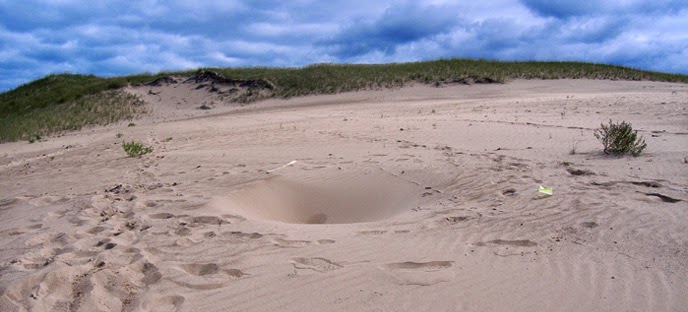
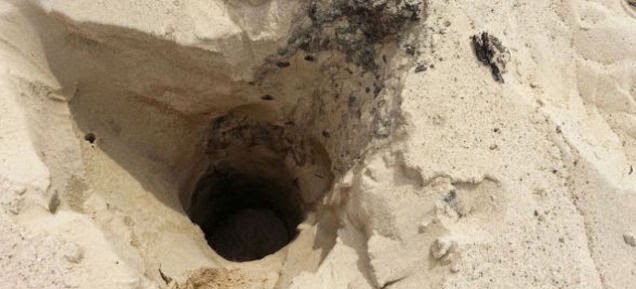
I love this story of the mysterious disappearing sinkholes of Indiana’s Mount Baldy, where deep pits in the sand dunes are opening and closing for reasons as yet to be determined. These “strange holes” have “appeared since last year, only to collapse and be filled in with sand a day later. Some of the holes were so deep they could not be measured with the researchers’ measuring tapes,” Livescience reports.

The area has thus been closed to the public while EPA scientists scan the site with ground-penetrating radar; this will help them to develop an “understanding of the overall internal architecture of the dune, using multispectral GPR and coring.”


After all, one of the leading theories is actually that buried structures, consumed by the dune’s migration over the past century, might have collapsed deep below the sand, creating these temporary sinkholes.

Imagine small buildings imploding under the weight of the landscape, like little cubic tombs held in place all this time by a dry glacier of sand and gravel, finally bursting inward as the strain becomes too much for them to carry—as if, beneath us in weird labyrinths of negative space, the invisible, slow-motion demolition of old buildings proceeds apace, detectable only as momentary pores and sinkholes breathing open and closed in the earth’s mobile surface.

(Images courtesy National Park Service).

Ghosts of Planets Past: An Interview with Ron Blakey

[Image: The west coast of North America as it appeared roughly 215 million years ago; map by Ron Blakey].

The paleo-tectonic maps of retired geologist Ronald Blakey are mesmerizing and impossible to forget once you’ve seen them. Catalogued on his website Colorado Plateau Geosystems, these maps show the world adrift, its landscapes breaking apart and reconnecting again in entirely new forms, where continents are as temporary as the island chains that regularly smash together to create them, on a timescale where even oceans that exist for tens of millions of years can disappear leaving only the subtlest of geological traces.

With a particular emphasis on North America and the U.S. Southwest—where Blakey still lives, in Flagstaff, Arizona—these visually engaging reconstructions of the Earth’s distant past show how dynamic a planet we live on, and imply yet more, unrecognizable changes ahead.

The following images come from Ron Blakey‘s maps of the paleotectonic evolution of North America. The first map shows the land 510 million years ago, progressing from there—reading left to right, top to bottom—through the accretion and dissolution of Pangaea into the most recent Ice Age and, in the final image, North America in its present-day configuration.


As part of BLDGBLOG’s collaborative side-project, Venue, Nicola Twilley and I met with Blakey in his Flagstaff home to talk about the tectonic processes that make and remake the surface of the Earth, the difficulty in representing these changes with both scientific accuracy and visual panache, and the specific satellite images and software tools he uses to create his unique brand of deep-time cartography.

Like film stills from a 600-million year-old blockbuster, Blakey’s maps take us back to the Precambrian—but there are much older eras still, stretching unmapped into far earlier continents and seas, and there are many more billions of years of continental evolution to come. Blakey talked us through some of the most complex changes in recent geological history, including the opening of the North Atlantic Ocean, and he allowed himself to speculate, albeit briefly, about where Earth’s continental crust might yet be headed (including a possible supercontinent in the Antarctic).

Many of Blakey’s maps are collected in the book Ancient Landscapes of the Colorado Plateau, written with Wayne Ranney, where Blakey also describes some of the research and methods that went into producing them. Blakey also contributed to the recent, new edition of a textbook by Wolfgang Frisch and Martin Meschede, Plate Tectonics: Continental Drift and Mountain Building, a thorough exploration of landscapes disassembling and colliding over vast spans of time.

• • •

[Image: The west coast of North America, depicted as it would have been 130 million years ago; the coast is a labyrinth of islands, lagoons, and peninsulas slowly colliding with the mainland to form the mountains and valleys we know today. Map by Ron Blakey].

Geoff Manaugh: When I first discovered your maps showing the gradual tectonic re-location of the continents over hundreds of millions of years, I thought this was exactly what geologists should be doing: offering clear, step-by-step visual narratives of the evolution of the earth’s surface so that people can better understand the planet we live on. What inspired you to make the maps, and how did you first got started with them?

Ronald Blakey: Well, the very first maps I made were in conjunction with my doctoral thesis, back in the early 1970s. Those were made with pen and ink. I made sketches to show what the paleogeography would have looked like for the specific formation I was studying with my doctorate. Three or four of those maps went into the thesis, which was then published by the Utah Geologic Survey. I’ve also done a number of papers over the years where I’ve made sketches.

But I was late getting into the computer. Basically, during my graduate work I never used a computer for anything. I kind of resisted it, because, for the kind of work I was doing, I just didn’t see a need for it—I didn’t do quantifiable kinds of things. Then, of course, along comes email and the Internet. I actually forget when I first started with Photoshop—probably in the mid-1990s. When I found that, I just thought, wow: the power of this is incredible. I quickly learned how to use the cloning tool, so that I could clone modern topography onto ancient maps, and that made things even simpler yet.

Another thing I started doing was putting these maps into presentations. There were something like five different programs back there, in the late 90s, but the only one that survived was PowerPoint—which is too bad, because it was far from the best of the programs. I was using a program called Astound, which was far superior, particularly in the transitions between screens. I could do simple animations. I could make the tectonic plates move, create mountain belts, and so forth.

I retired in May of 2009, but all of my early maps are now online. With each generation of maps that I’ve done, there has been a noted improvement over earlier maps. I find new techniques and, when you work with Photoshop as much as I do, you learn new ideas and you find ways to make things that were a little clumsy look more smooth.

Manaugh: Where does the data come from?

Blakey: It comes from various publications. You can get a publication and have that PDF open, showing what something looked like in the past, and work from that. Usually, what I’m working from are fairly simple sketches published in the literature. They’ll show a subduction zone and a series of violent arcs, or a collision zone. What I do is take this information and make it more pictorial.

If you create a series of maps in sequence, you can create them in such a way that certain geologic events, from one time slice to the next, to the next, to the next, will blend. It depends a lot on the scale of what you’re trying to show—the whole world versus just four or five states in the West.

Now, throughout the years from, let’s say, 2004 until I retired in 2009, I kept improving the website. I envisioned most of this as educational material, and I didn’t pay much attention to who used it, how they used it, and so forth. But, then, shortly before I retired, various book companies and museums—and, most recently, oil companies—have approached me. So I started selling these and I tried very diligently not to allow this to overlap with what I was doing for my teaching and my research at the University.

In the following long sequence of images, we see the evolution of the west coast of North America, its state boundaries ghosted in for reference. Sea levels rise and fall; island chains emerge and collide; mountains form; inland seas proliferate and drain; and, eventually, modern day California, Vancouver Island, and the Baja peninsula take shape, among other recognizable features. The time frame represented by these images is approximately 500 million years. All maps by Ron Blakey.


Nicola Twilley: What do the oil companies want them for?

Blakey: They’re my biggest customers now. Usually, the geologists at oil companies are working with people who know either much less geology than they do or, in some cases, almost no geology at all, yet they’re trying to convince these people that this is where they need to explore, or this is what they need to do next.

They find these maps very useful to show what the Devonian of North Dakota looked like, for example, which is a hot spot right now with all the shales that they’re developing in the Williston Basin. What they like is that I show what the area might have really looked like. This helps, particularly with people who have only a modest understanding of geology, particularly the geologic past.

Manaugh: What have been some of the most difficult regions or geological eras to map?

Blakey: The most difficult thing to depict is back in the Paleozoic and the Mesozoic. Large areas of the continent were flooded, deep into the interior.

During certain periods, like the Ordovician, the Devonian, and parts of the Jurassic—especially the Cretaceous—as much as two-thirds of the continents were underwater. But they’re still continents; they’re still continental crusts. They’re not oceans. The sea level was just high enough, with respect to where the landscape was at the time, that the area was flooded. Of course, this is a concept that non-geologists really have problems with, because they don’t understand the processes of how continents get uplifted and subside and erode and so forth, but this is one of the concepts that my maps show quite nicely: the seas coming in and retreating.

But it’s very difficult—I mean, there is no modern analog for a seaway that stretched from the Mackenzie River Delta in Canada to the Gulf of Mexico and that was 400 miles wide. There’s nothing like that on Earth today. But the styles of mountains have not dramatically changed over the last probably two billion years—maybe even longer than that. I don’t go back that far—I tend to stick with the last 600 million years or so—but the styles of mountains haven’t changed. The nature of island arcs hasn’t changed, as far as we know.

What has changed is the amount of vegetation on the landscape. My maps that are in the early part of the Paleozoic—the Cambrian and the Ordovician early part of the Silurian—tend to be drab-colored. Then, in the late Silurian and in the Devonian, when the land plants developed, I start bringing vegetation colors in. I try to show the broad patterns of climate. Not in detail, of course—there’s a lot of controversy about certain paleoclimates. But, basically, paleoclimates follow the same kinds of regimens that the modern climates are following: where the oceans are, where the equator is, where the mountain ranges are, and so forth.

That means you can make broad predictions about what a paleoclimate would have been based on its relationship to the equator or based on the presence or absence of nearby mountains. I use these kinds of principles to show more arid areas versus more humid areas.

The next three sequences show the evolution of the Earth’s surface in reverse, from the present day to, at the very bottom, 600 million years ago, when nearly all of the planet’s landmasses were joined together in the Antarctic. The first sequence shows roughly 90 million years of backward evolution, the continents pulling apart from one another and beginning a slow drift south. They were mapped using the Mollweide projection, and, in all cases, are by Ron Blakey.


Twilley: And you paint the arid area based on a contemporary analog?

Blakey: Right. I know the modern world reasonably well and I’ll choose something today that might have matched the texture and aridity of that older landscape.

I use a program called GeoMapApp that gives me digital elevation maps for anywhere in the world. Most recently, they have coupled it with what they call the “Blue Marble.” NASA has stitched together a bunch of satellite photos of the world in such a way that you can’t tell where one series of photos come in or another. It’s a fairly true-color representation of what Earth would look like from space. So this Blue Marble is coupled with the GeoMapApp’s digital elevation topography; you put the Blue Marble over it, and you use a little slider to let the topography show through, and it gives you a fairly realistic looking picture of what you’re looking for.

For example, if I’m working with a mountain range in the southern Appalachians for a Devonian map—well, the southern Appalachians, during the Devonian, were probably far enough away from the equator that it was in the arid belt. There are some indications of that, as well—salt deposits in the Michigan Basin and in parts of New York and so forth. Plus, there are red-colored sediments, which don’t prove but tend to indicate arid environments. This combination tells me that this part of the world was fairly arid. So I’m going to places like modern Afghanistan, extreme western China, northern Turkey, or other places where there are somewhat arid climates with mountain belts today. Then I clone the mountains from there and put them in the map.

But you have to know the geologic background. You have to know how the mountains were formed, what the grain of the mountains was. That’s not always easy, although there are ways of doing it. To know the grain of the mountains, you need to know where the hinterland and the center of the mountains were. You need to know where the foreland area is, so that you can show the different styles of mountains. You have to move from foreland areas—which tends to be a series of parallel ridges, usually much lower than the hinterlands—to the center and beyond.

I use this kind of information to pick the right kind of modern mountain to put back in the Devonian, based on what that Devonian landscape probably had a good chance of looking like. Do we know for certain? Of course not. We weren’t around in the Devonian. But we have a good rock record and we have a lot of information; so we use that information and, then, voilà.

To give another example, let’s look at the Devonian period of the east coast. The big European continent that we call Baltica collided with Greenland and a series of micro-continents collided further south, all the way down at least as far as New Jersey, if not down as far the Carolinas. We know that there are places on Earth today where these same kinds of collisions are taking place—in the Alps and Mediterranean region, and the Caucasus region, and so forth.

We can use the concept that, if two plates are colliding today to produce the Caucasus mountains, and if we look at the style of mountains that the Caucasus are, then it’s reasonable to think that, where Greenland and Baltica collided in the Silurian and the Devonian, the mountains would have had a similar style. So we can map that.

This second sequence shows the continents drifting apart, in reverse, from 105 million years ago to 240 million years ago. They were mapped using the Mollweide projection, and, in all cases, are by Ron Blakey.


Manaugh: That collision alone—Baltica and Greenland—sounds like something that would be extremely difficult to map.

Blakey: Absolutely. And it’s not a one-to-one relationship. You have to look at the whole pattern of how the plates collided, how big the plates were, and so forth.

Then there’s the question of the different histories of particular plates. So, for example, most of Scotland started out as North America. Then, when all the continents collided to form Pangaea, the first collisions took place in the Silurian-Devonian and the final collisions took place in the Pennsylvanian-Permian. By, say, 250 million years ago, most of the continents were together. Then, when they started to split apart in the Triassic and Jurassic—especially in the Triassic and Cretaceous—the split occurred in such a way that what had been part of North America was actually captured, if you will, by Europe and taken over to become the British Isles.

Scotland and at least the northern half of Ireland were captured and began to drift with Europe. On the other hand, North America picked up Florida—which used to be part of Gondwana—and so forth.

One of the things that is interesting is the way that, when mountains come together and then finally break up, they usually don’t break up the same way that they came together. Sometimes they do, but it has to do with weaknesses, stress patterns, and things like this. Obviously, all time is extremely relative, but mountains don’t last that long. A given mountain range that’s been formed by a simple collision—not that there’s any such thing as a simple collision—once that collision is over with, 40 or 50 million years after that event, there is only low-lying landscape. It may have even have split apart already into a new ocean basin.

But here’s the important part: the structure that was created by that collision is still there, even though the mountains have been worn down. It’s like when you cut a piece of wood: the grain is still inherited from when that tree grew. The pattern of the grain still shows where the branches were, and the direction of the tree’s growth in response to wind and sun and its neighbors. You can’t reconstruct the tree exactly from its grain, but, if you’re an expert with wood, you should be able to look and say: here are the tree rings, and here’s a year where the tree grew fast, here’s a year where the tree grew slow, here’s where the tree grew branches, etc.

In a sense, as geologists, we’re doing the same things with rock structure. We can tell by the pattern of how the rocks are deformed which direction the forces came from. With mountains, you can tell the angle at which the plates collided. It’s usually very oblique. What that tends to do is complicate the geologic structure, because you not only get things moving one way, but you get things dragging the other way, as well. But we can usually tell the angle at which the plates hit.

Then, in many cases, based upon the nature of how the crust has been deformed and stacked up, we can tell the severity of the mountain range. It doesn’t necessarily mean that we can say: oh, this structure would have been a twenty-thousand-foot high mountain range. It’s not that simple at all, not least of which because rocks can deform pretty severely without making towering mountains.

This final of the three global sequences shows the continents drifting apart, in reverse, from 260 million years ago to 600 million years ago. There was still nearly 4 billion years of tectonic evolution prior to where these maps begin. They were mapped using the Mollweide projection, and, in all cases, are by Ron Blakey.


Manaugh: Are you able to project these same tectonic movements and geological processes into the future and show what the earth might look like in, say, 250 million years?

Blakey: I’ve had a number of people ask me about that, so I did make some global maps. I think I made six of them at about 50-million-year intervals. For the fifteen to 100-million-year range, I think you can say they are fairly realistic. But, once you get much past 75 to 100 million years, it starts to get really, really speculative. The plates do strange things. I’ll give you just a couple of quick examples.

The Atlantic Ocean opened in the beginning of the Jurassic. The actual opening probably started off the coasts of roughly what is now Connecticut down to the Carolinas. That’s where the first opening started. So the central part of the Atlantic was the first part to open up. It opened up reasonably simply—but, again, I’m using the word simple with caution here.

The north Atlantic, meanwhile, didn’t open up until about 60 to 50 million years ago. When it opened up, it did a bunch of strange things. The first opening took place between Britain and an offshore bank that’s mostly submerged, called Rockall. Rockall is out in the Atlantic Ocean, northwest of Ireland—near Iceland—but it’s continental crust. That splitting process went on for, let’s say, ten million years or so—I’m just going to talk in broad terms—as the ocean started opening up.

Then the whole thing jumped. A second opening began over between Greenland and North America, as Greenland and North America began to separate off. That lasted for a good 40 or 50 million years. That’s where you now get the Labrador Sea; that is actual ocean crust. So that was the Atlantic Ocean for thirty or forty million years—but then it jumped again, this time over between Greenland and what is now the west coast of Europe. It started opening up over there, before it jumped yet again. There’s an island in the middle of the North Atlantic, way the heck up there, called Jan Mayen. At one time, it was actually part of Greenland. The Atlantic opened between it and Greenland and then shifted to the other side and made its final opening.

The following two sequences show the evolution of Europe from an Antarctic archipelago to a tropical island chain to the present day Europe we know and recognize. The first sequence starts roughly 450 million years ago and continues to the Jurassic, 200 million years ago. All maps by Ron Blakey.


So it’s very complicated. And that’s just the Atlantic Ocean.

The Northern Atlantic took at least five different paths before the final path was established, and it’s all still changing. In fact, the south Atlantic is actually even worse; it’s an even bigger mess. You’ve got multiple openings between southwest Africa and Argentina, plus Antarctica was up in there before it pulled away to the south.

These complications are what makes this stuff so interesting. If we look at events that we can understand pretty well over the last, let’s say, 150 or 200 million years of time—where we have a good indication of where the oceans were because we still have ocean crusts of that age—then we can extrapolate from that back to past times when oceans were created and destroyed. We can follow the rules that are going on today to see all of the oddities and the exceptions and so forth.

These are the kinds of things I try to keep track of when I’m making these maps. I’m always asking: what do we know? Was it a simple pull-apart process? There are examples where continents started to split across from one another, then came back together, then re-split in a different spot later on. That’s not just speculation—there is geologic evidence for this in the rock record.

So, when it comes to extrapolating future geologies, things become very complicated very quickly. If you start thinking about the behavior of the north Atlantic, creating a projection based on what’s going on today seems, at first, like a fairly simple chore. North America is going on a northwesterly path at only one or two centimeters a year. Europe is moving away, at almost a right angle, at about another centimeter a year. So the Atlantic is only opening at three centimeters a year; it’s one of the slowest-opening oceans right now.

OK, fine—but what else is happening? The Caribbean is pushing up into the Atlantic and, off South America, there is the Scotia Arc. Both of those are growing. They’ve also identified what looks like a new island arc off the western Mediterranean region; that eventually would start to close the Atlantic in that area. Now you start to speculate: well, these arcs will start to grow, and they’ll start to eat into the oceans, and subduct the crusts, and so forth.

Again, for the first 50, 75, or even 100 million years, you can say that these particular movements are fairly likely. But, once you get past that, you can still use geologic principles, but you’re just speculating as to which way the continents are going to go.

For instance, the one continent that does not seem to be moving at all right now, relative to anything else, is Antarctica. It seems to be really fixed on the South Pole. That’s why some people think that everything will actually coagulate back towards the South Pole. However, there are also a bunch of subduction zones today along southern Asia, and those are pretty strong subduction zones. Those are the ones that created the big tsunami, and all the earthquakes off of Indonesia and so forth. Eventually, those could pull either parts of Antarctica or all of Antarctica up toward them.

But I’m more interested in reconstructing the past than I am the future, so I’ve only played around with those five or six maps.

This second sequence, showing the next phase in the evolution of Europe, begins approximately 150 million years ago and extends to the present day. All maps by Ron Blakey.


Manaugh: To ground things a bit, we’re having this conversation in Flagstaff, on the Colorado Plateau, which seems like a great place to teach geology. I wonder whether there might be another Colorado Plateau, so to speak, elsewhere in the world—something geologically similar to the extraordinary landscapes we see here that just hasn’t had the chance to emerge. Maybe the tectonics aren’t right, and it’s still just a crack, rather than a canyon, or maybe it’s covered in vegetation or ice so we can’t see it yet. Conversely, I’m curious if you might have found evidence of other great geological districts in the earth’s past—lost Grand Canyons, other Arches National Parks—that have been lost to time. How could we detect those, and where are they?

Blakey: This is indeed a great place to teach geology. It’s a great place to live.

As for Colorado Plateau analogs—it’s an interesting question. There’s an area in South America that I’d say is fairly similar. It’s got a couple of famous national parks that I can’t remember the name of. It’s a smaller version, but it’s very similar to the Colorado Plateau. It’s between the Andes and the Amazon basin, part of the general pampas region there of South America. It even has similarly aged rocks. Parts of northern Africa would also be similar.

But you have to look at all the characteristics of the Plateau. Number one: the rocks are flat. Number two: the rocks have been uplifted. Number three: the rocks are dissected by a major river system. Number four: it’s a semi-arid climate. There are probably five or six defining characteristics in total, and I’ve heard many people say that there is no other place else on Earth that has all those characteristics in exactly the same way. But I went to an area in eastern Mauritania many years ago, where, for all the world, it looked like the Grand Canyon. It wasn’t as colorful, but it was a big, deep canyon.

In fact, the Appalachian Plateau would be somewhat similar, except it’s in a humid climate, which means the land has been shaped and formed differently. But the Appalachian plateau has flat-lying rocks; it’s dissected by some major rivers; it’s experienced uplift; and so forth.

The next two sequences of images, followed from left to right, top to bottom, illustrate the gradual evolution of the Colorado Plateau, where, in its modern day incarnation, this interview with Ron Blakey took place (specifically, in Flagstaff, Arizona. The earliest map included here depicts the Proterozoic; the first sequence ends in the Triassic. All maps by Ron Blakey.


Twilley: I’m interested in the representational challenges you face when you decide to make a map, and, specifically, when you’re in Photoshop, what your most-used tools might be. I thought it was fascinating when you said that the cloning tool really changed how you make geological maps. What other techniques are important to you, in order to represent geological histories?

Blakey: Oh, the cloning tool is the most important, by far—at least when I’m actually painting. Of course, I use the outline tool to select areas, but, when I’m actually painting, it would be impossible to paint these different maps pixel by pixel. I couldn’t do it. Occasionally, I will actually hand-draw some things in the flatlands, where I want to put a river system, for example, but, at least for mountains and rugged terrain, I clone everything.

Some times, I’ll cut and paste. I’ll select an area in the GeoMapApp, I save it as a JPEG, and then I can select it and copy it and paste it in, and I can rotate and deform it a little bit. Are you familiar with the warp tool in Photoshop? I use that a lot, because you can change the shape of mountains a little. If you do it too dramatically, it really looks flaky. But, if you do it right, it still looks pretty realistic.

This second sequence, also showing the evolution of the Colorado Plateau, begins with the Triassic and ends roughly 5 million years ago—basically the present day, in geological terms. All maps by Ron Blakey.


Twilley: And do you have certain filters you rely on for particular geological effects?

Blakey: A little bit. I like to use the craquelure filter. It actually gives you little bumps and valleys and so forth. I use that especially for continental margins. Continental margins are anything but regular slopes, going down to the abyssal depths. They’re very irregular. There are landslides and all kinds of things going on there at the margins, so I add a little texture with craquelure.

It can be difficult to use, though, and it doesn’t work at really high resolutions—so, what I actually have to do some times, is that I will actually copy a part of my map, take it out, make it smaller, do the craquelure on it, and then blow it back up and paste it in again.

[Image: A painting by Ron Blakey depicts a geological landscape near Sedona, Arizona].

Dee Blakey, Ron’s Wife: I think the other reason that he can do what he does is that he paints. That’s one of his paintings over there. [gestures above fireplace]

Blakey: Well, I guess I should have said that right away, when you asked me why I got interested in this, because I am interested in the artistic aspect of geology. The artistic aspect of science, in general, but especially geology. Astronomy, for example, would be another field where artistic visualizations are useful—any time you’re trying to show things that can’t easily be visualized with something comparable here on present-day planet Earth, you have to use an artistic interpretation.

Anyway, I can’t explain it, but I understand color pretty well. I use the hue saturation tool a lot. I’ll select an area and then I’ll feather it, let’s say, because you don’t want the edges to be sharp. I’ll feather it by thirty, forty, fifty pixels. Then I’ll take the slider for hue saturation, where, if you go to the left, you make things redder and, if you go to the right, you make things greener. If I’ve got a landscape that looks a little too humid, I’ll just slide it slightly to the left to make it a bit redder. You can also change the lightness and darkness when you do that. There’s also regular saturation. By killing the saturation, you can really kill the nature of a landscape quite a bit.

And I use hue saturation a lot. That took me a long time to master, because it’s really easy to screw things up with that tool. You start sliding things a little too far and, whoa—wait a minute! All of a sudden, you’ve got purple mountains.

• • •

For more Venue interviews, be sure to stop by the Venue website.

Landscape Futures Arrives

[Image: Internal title page from Landscape Futures; book design by Everything-Type-Company].

At long last, after a delay from the printer, Landscape Futures: Instruments, Devices and Architectural Inventions is finally out and shipping internationally.

I am incredibly excited about the book, to be honest, and about the huge variety of content it features, including an original essay by Elizabeth Ellsworth & Jamie Kruse of Smudge Studio, a short piece of landscape fiction by Pushcart Prize-winning author Scott Geiger, and a readymade course outline—open for anyone looking to teach a course on oceanographic instrumentation—by Mammoth’s Rob Holmes.

These join reprints of classic texts by geologist Jan Zalasiewicz, on the incipient fossilization of our cities 100 million years from now; a look at the perverse history of weather warfare and the possibility of planetary-scale climate manipulation by James Fleming; and a brilliant analysis of the Temple of Dendur, currently held deep in the controlled atmosphere of New York’s Metropolitan Museum of Art, and its implications for architectural preservation elsewhere.

And even these are complemented by an urban hiking tour by the Center for Land Use Interpretation that takes you up into the hills of Los Angeles to visit check dams, debris basins, radio antennas, and cell phone towers, and a series of ultra-short stories set in a Chicago yet to come by Pruned‘s Alexander Trevi.

[Images: A few spreads from the “Landscape Futures Sourcebook” featured in Landscape Futures; book design by Everything-Type-Company].

Of course, everything just listed supplements and expands on the heart of the book, which documents the eponymous exhibition hosted at the Nevada Museum of Art, featuring specially commissioned work by Smout Allen, David Gissen, and The Living, and pre-existing work by Liam Young, Chris Woebken & Kenichi Okada, and Lateral Office.

Extensive original interviews with the exhibiting architects and designers, and a long curator’s essay—describing the exhibition’s focus on the intermediary devices, instruments, and spatial machines that can fundamentally transform how human beings perceive and understand the landscapes around them—complete the book, in addition to hundreds of images, many maps, and an extensive use of metallic and fluorescent inks.

The book is currently only $17.97 on Amazon.com, as well, which seems like an almost unbelievable deal; now is an awesome time to buy a copy.

[Images: Interview spreads from Landscape Futures; book design by Everything-Type-Company].

In any case, I’ve written about Landscape Futures here before, and an exhaustive preview of it can be seen in this earlier post.

I just wanted to put up a notice that the book is finally shipping worldwide, with a new publication date of August 2013, and I look forward to hearing what people think. Enjoy!

Mountain View

[Image: Courtesy of the U.S. Library of Congress Prints & Photographs Division].

After posting several of these images in our recent Venue interview with outdoor equipment strategist Scott McGuire—easily one of my favorite interviews of late, touching on everything from civilianized military gear used in everyday hiking to REI-augmented wilderness camp sites as the true heirs of Archigram—I was so taken by their weirdly haunting views of humans wandering through extreme landscapes, dressed in 19th-century suits and top hats, carrying canes, that I thought I’d post a larger selection.

[Images: Courtesy of the U.S. Library of Congress Prints & Photographs Division].

Middle class gentlemen and ladies in hooped skirts walk into ice caves and step gingerly across the cracked, abyssal surfaces of old mountain glaciers, pointing up at things they don’t understand.

[Image: Courtesy of the U.S. Library of Congress Prints & Photographs Division].

At times, these feel almost like photos from some as-yet-unwritten Gothic horror story, perhaps a 19th-century Swiss prequel to John Carpenter’s The Thing, in which purely accidental sequences of photos—

[Images: Courtesy of the U.S. Library of Congress Prints & Photographs Division].

—imply a narrative of genial discovery, focused exploration, and eventual solo flight down the mountainside in terror.

In fact, I could easily imagine an Alpine variation on Michelle Paver’s memorably unsettling Arctic ghost novel Dark Matter set in such geologically extravagant landscapes, as humans struggle to survive, both physically and psychologically, in this encounter with an incomprehensibly over-sized landscape millions of years older than they might ever be, naively setting up camp amidst a wilderness that does not want them there.

[Images: Courtesy of the U.S. Library of Congress Prints & Photographs Division].

But then, at other times, these photos are almost like exaggerated set pieces by artists Kahn & Selesnick, whose work proposes fictional expeditions to otherworldly landscapes, missions to the moon, ancient salt cities, and more, all told through an almost unbelievably elaborate series of props, fake postcards, paintings, photographs, and more.

Like some unrealized backstory for their “Eisbergfreistadt” project, for example, or their “Circular River” expedition, men in wool vests pull one another up abstract glacial forms, as an incredible wooden staircase—if you look closely at the next image—races up the mountainside in the middle of nowhere.

[Image: Courtesy of the U.S. Library of Congress Prints & Photographs Division].

After a point, these scenes are Chaplinesque and ridiculous, like turn-of-the-century bankers who got lost on a glacier in a Modernist play.

[Image: Courtesy of the U.S. Library of Congress Prints & Photographs Division].

In any case, these all come courtesy of the U.S. Library of Congress Prints & Photographs Division, where substantially higher-res versions of each photo are available; but don’t miss the additional photos in the interview with Scott McGuire over at Venue.

[Images: Courtesy of the U.S. Library of Congress Prints & Photographs Division].