Back in the summer of 2012, Nicola Twilley and I got to visit the headquarters of GPS, out at Schriever Air Force Base in Colorado.
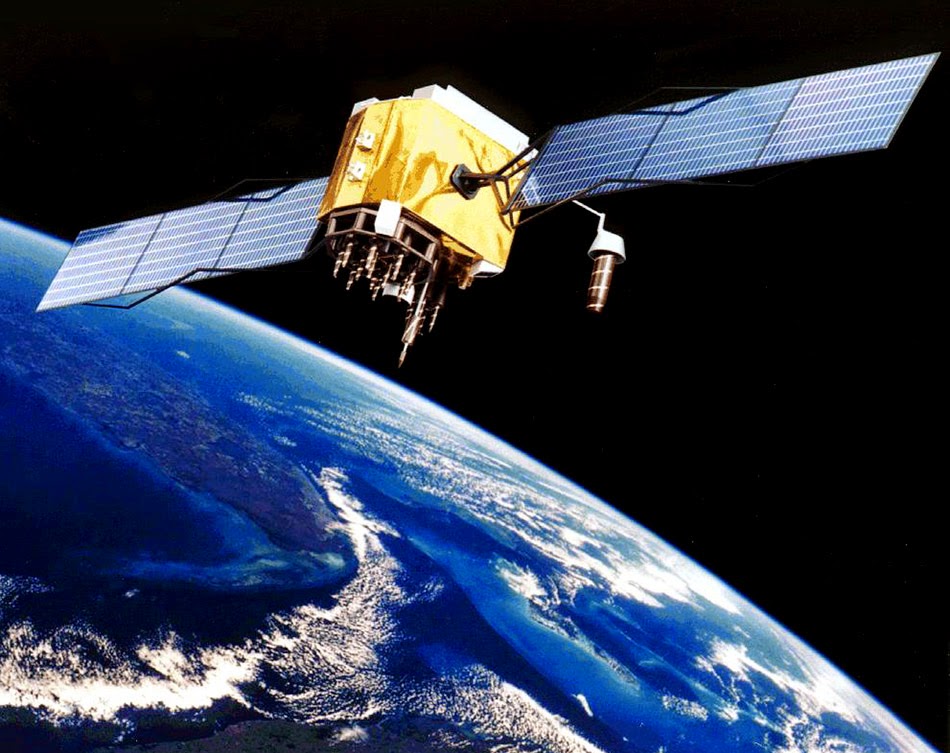 [Image: Artist’s rendering of a GPS satellite, via Wikipedia].
“Masters of Space”
Over the course of a roughly two-hour visit, we toured, among other things, the highly secure, windowless office room out of which the satellites that control GPS are monitored and operated. Of course, GPS–the Global Positioning System—is a constellation of 32 satellites, and it supplies vital navigational information for everything from smartphones, cars, and construction equipment to intercontinental missiles.
It is “the world’s largest military satellite constellation,” Schriever Air Force Base justifiably boasts.
For somewhat obvious reasons, Nicola and I were not allowed to bring any audio or video recording devices into the facility (although I was able to take notes), and we had to pass through secure checkpoint after secure checkpoint on our way to the actual room. Most memorable was the final door that led to the actual control room: it was on a 15-second emergency response, meaning that, if the door stayed open for more than 15 seconds, an armed SWAT team would arrive to see what was wrong.
When we got inside the actual office space, the lights were quite low and at least one flashing red light reminded everyone inside that civilians were now present; this meant that nothing classified could be discussed. Indeed, if anyone needed to hop on the telephone, they first needed to shout, “Open line!” to make sure that everyone knew not to discuss classified information, lest someone on the other end of the phonecall might hear.
Someone had even made a little JPG for us, welcoming “Geoff Manaugh and Nicola Twilley” to the GPS HQ, and it remained on all the TV monitors while we were there inside the space.
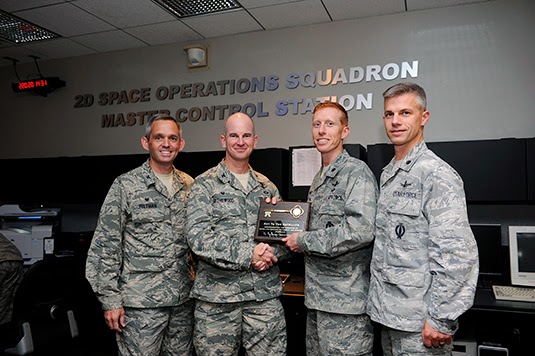 [Image: Transferring control over the GPS constellation. Photo courtesy U.S. Air Force/no photographer given].
Surreally, in a room without windows, a group of soldiers who, on the day we visited, were all-male and looked no more than 23 or 24 years old, wore full military camouflage, despite the absence of vegetation to blend into, as they controlled the satellites.
At one point, a soldier began uploading new instructions to the satellites, and we watched and listened as one of those artificial stars assumed its new place in the firmament. What would Giordano Bruno have made of such a place?
This was the room behind the curtain, so to speak, a secure office out of which our nation’s surrogate astronomy is maintained and guided.
Appropriately, they call themselves “Masters of Space.”
 [Image: A “Master of Space” badge from Schriever Air Force Base].
In any case, I mention all this for at least two reasons:
A 50,000km-Wide Dark Matter Detector
Edge to edge, the GPS constellation can apparently be considered something of a single device, a massive super-detector whose “time glitches” could be analyzed for signs of dark matter.
As New Scientist explained last month, “The network of satellites is about 50,000 kilometers in diameter, and is traveling through space—along with the entire solar system—at about 300 kilometers a second. So any time shift when the solar system passes through a cosmic kink will take a maximum of 170 seconds to move across network.”
The temporal distortion—a kind of spacetime wave—would propagate across the constellation, taking as long as 170 seconds to pass from one side to the other, leaving forensically visible traces in GPS’s navigational timestamps.
The very idea of a 50,000-kilometer wide super-device barreling through “cosmic kinks” in spacetime is already mind-bogglingly awesome, but add to this the fact that the “device” is actually an artificial constellation run by the U.S. military, and it’s as if we are all living inside an immersive, semi-weaponized, three-dimensional spacetime instrument, sloshing back and forth with 170-second-long tides of darkness, the black ropes of spacetime being strummed by the edges of a 32-point star.
Even better, those same cosmic kinks could theoretically show up as otherwise imperceptible moments of locational error on your own smartphone. This would thus enlist you, against your knowledge, as a minor relay point in a dark matter detector larger than the planet Earth.
The Architectural Effects of Space Weather
While Nicola and I were out at the GPS headquarters in Colorado, one of the custodians of the constellation took us aside to talk about all the various uses of the navigational information being generated by the satellites—including, he pointed out, how they worked to mitigate or avoid errors.
Here, he specifically mentioned the risk of space weather affecting the accuracy of GPS—that is, things like solar flares and other solar magnetic events. These can throw-off the artificial stars of the GPS constellation, leading to temporarily inaccurate location data—which can then mislead our construction equipment here on Earth, even if only by a factor of millimeters.
What’s so interesting and provocative about this is that these tiny errors created by space weather risk becoming permanently inscribed into the built environment—or fossilized there, in a sense, due to the reliance of today’s construction equipment on these fragile signals from space.
That 5mm shift in height from one pillar to the next would thus be no mere construction error: it would be architectural evidence for a magnetic storm on the sun.
Take the Millau Viaduct—just one random example about which I happen to have seen a construction documentary. That’s the massive and quite beautiful bridge designed by Foster + Partners, constructed in France.
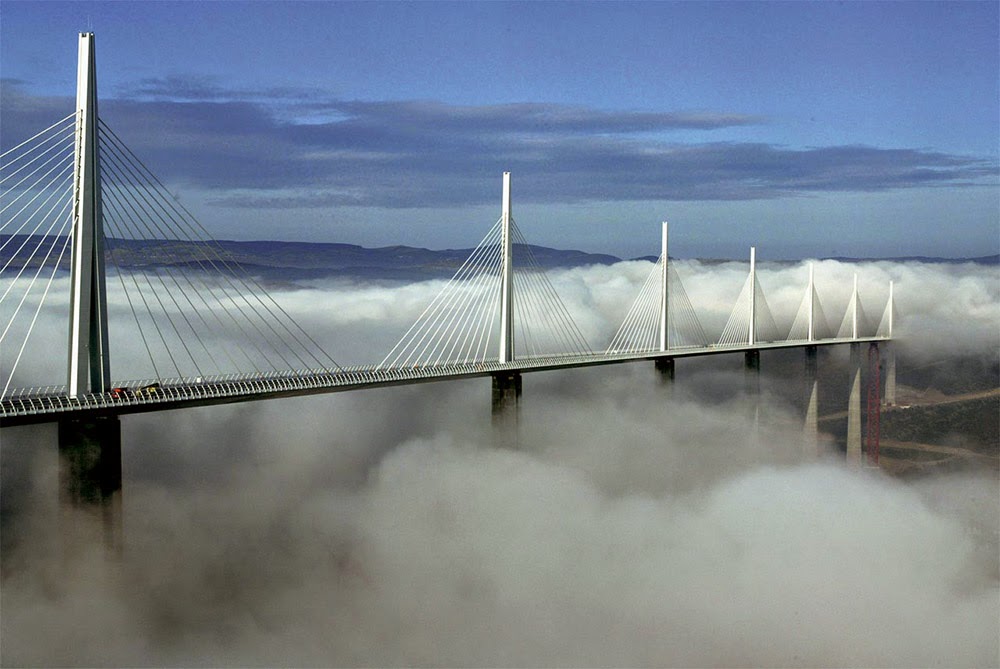 [Image: The Millau Viaduct, courtesy of Foster + Partners].
The precision required by the bridge made GPS-based location data indispensable to the construction process: “Altimetric checks by GPS ensured a precision of the order of 5mm in both X and Y directions,” we read in this PDF.
But even—or perhaps especially—this level of precision was vulnerable to the distorting effects of space weather.
Evidence of the Universe
I have always loved this quotation from Earth’s Magnetism in the Age of Sail, by A.R.T. Jonkers:
In 1904 a young American named Andrew Ellicott Douglass started to collect tree specimens. He was not seeking a pastime to fill his hours of leisure; his motivation was purely professional. Yet he was not employed by any forestry department or timber company, and he was neither a gardener not a botanist. For decades he continued to amass chunks of wood, all because of a lingering suspicion that a tree’s bark was shielding more than sap and cellulose. He was not interested in termites, or fungal parasites, or extracting new medicine from plants. Douglass was an astronomer, and he was searching for evidence of sunspots.
Imagine doing the same thing as Andrew Ellicott Douglass, but, instead of collecting tree rings, you perform an ultra-precise analysis of modern megastructures that were built using machines guided by GPS.
You’re not looking for lost details of architectural history. You’re looking for evidence of space weather inadvertently preserved in titanic structures such as the Millau Viaduct.
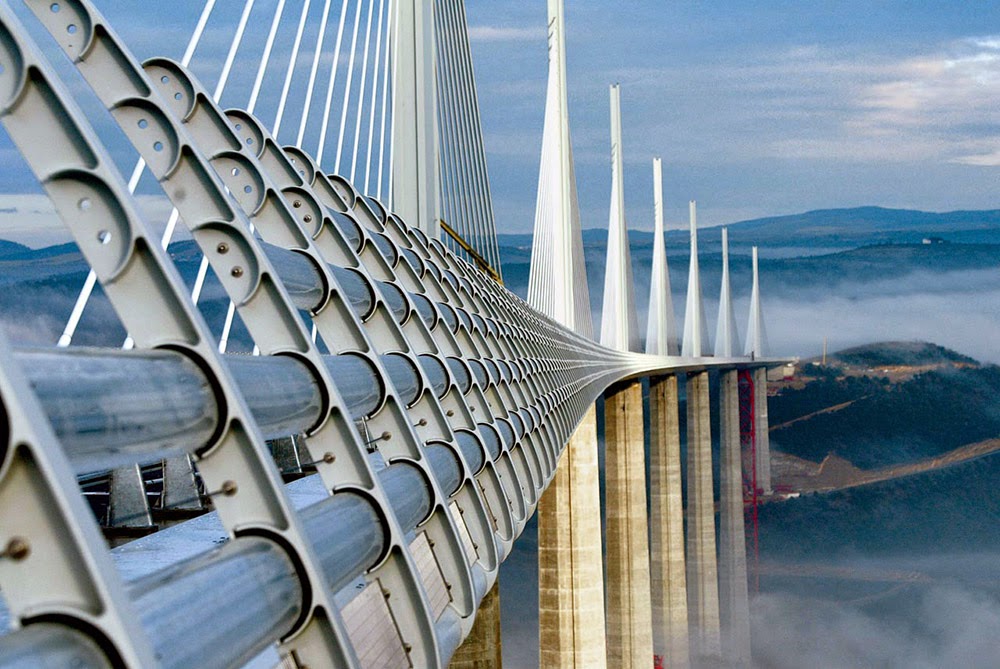 [Image: The Millau Viaduct, courtesy of Foster + Partners].
Fossils of Spacetime
If you take all of this to its logical conclusion, you could argue that, hidden in the tiniest spatial glitches of the built environment, there is evidence not only of space weather but even potentially of the solar system’s passage through “kinks” and other “topological defects” of dark matter, brief stutters of the universe now fossilized in the steel and concrete of super-projects like bridges and dams.
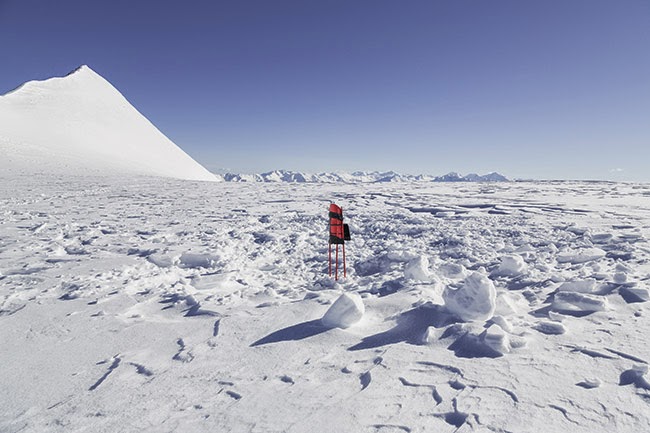
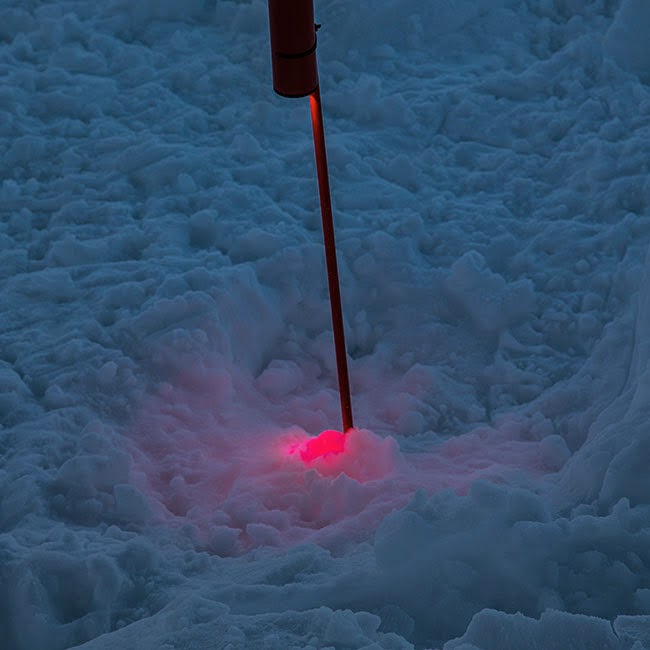
New Scientist points out that a physicist named Andrei Derevianko, from the University of Nevada at Reno, is “already mining 15 years’ worth of GPS timing data for dark matter’s fingerprints,” hoping to prove that GPS errors do, indeed, reveal a deeper, invisible layer of the universe—but how incredibly interesting would it be if, somehow, this same data could be lifted from the built environment itself, secretly found there, inscribed in the imprecisions of construction equipment, perhaps detectable even in the locational drift as revealed by art projects like the Satellite Lamps of Einar Sneve Martinussen, Jørn Knutsen, and Timo Arnall?
The bigger the project, the more likely its GPS errors could be read or made visible—where unexpected curves, glitches, changes in height, or other minor inaccuracies are not just frustrating imperfections caused by inattentive construction engineers, but are actually evidence of spacetime itself, of all the bulging defects and distortions through which our planet must constantly pass now frozen into the built environment all around us.
(Very vaguely related: One of my personal favorite stories here, The Planetary Super-Surface of San Bernardino County).
 [Image: The same point in Shanghai, shifted between its map and satellite view; via Google Maps].
 [Image: Isochronic map of travel distances from London, from An Atlas of Economic Geography (1914) by John G. Bartholomew (
 [Image: From
 [Image: The GPS contraption; photo via
 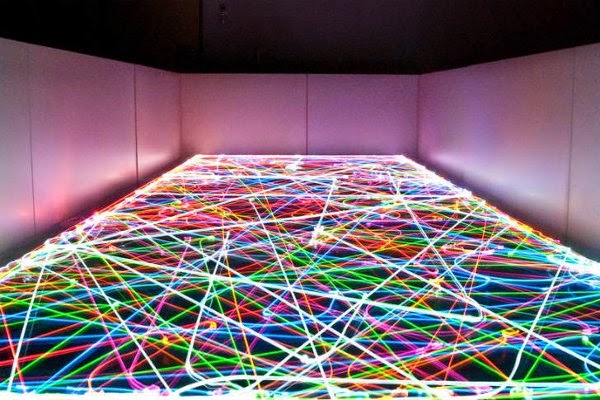 [Image: Roomba-based LED art, via
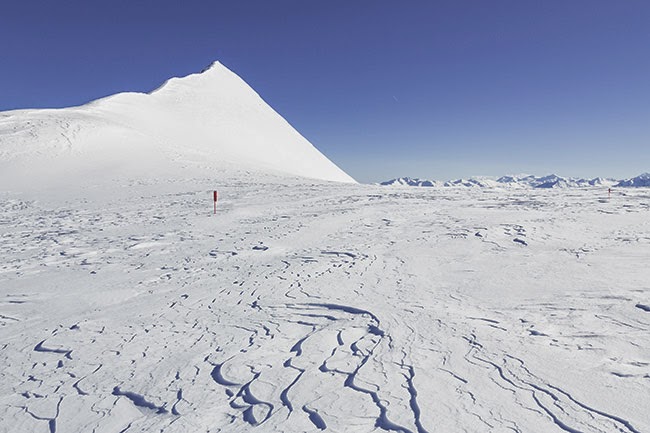
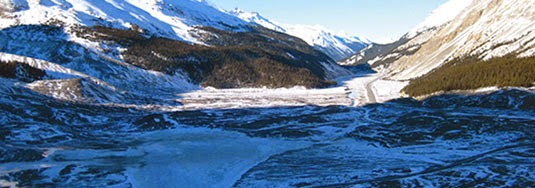 [Image: Jasper National Park, courtesy of
 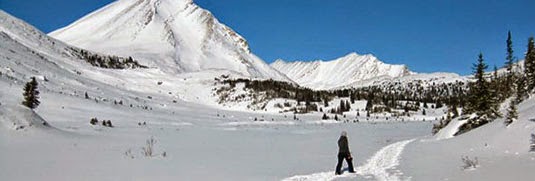 [Image: Jasper National Park, courtesy of
 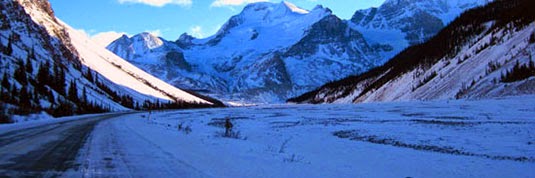 [Image: Jasper National Park, courtesy of

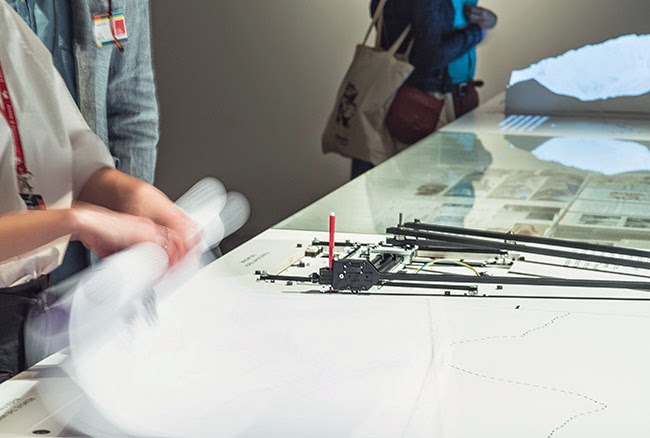
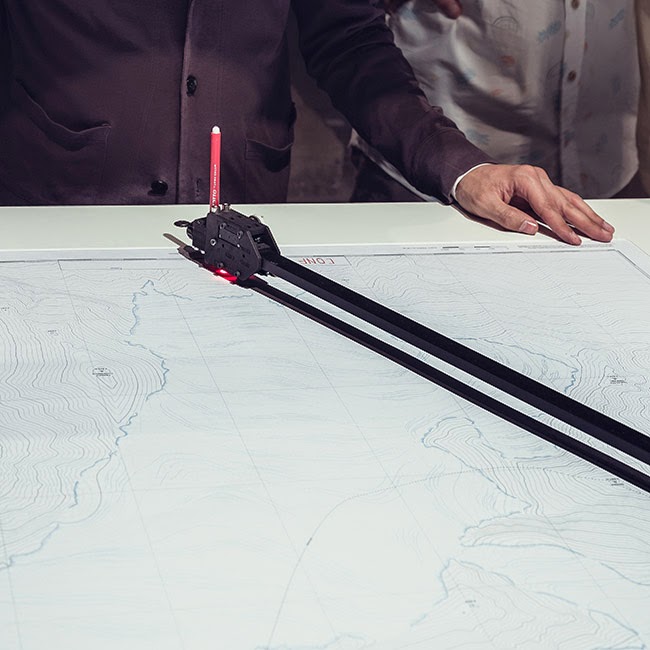
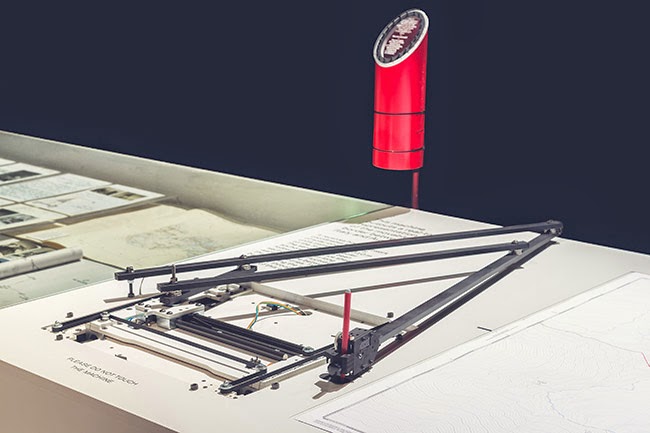
 [Image: “Cultivating the Map” by Danny Wills].

 [Images: “Cultivating the Map” by Danny Wills].


 [Images: “Cultivating the Map” by Danny Wills].
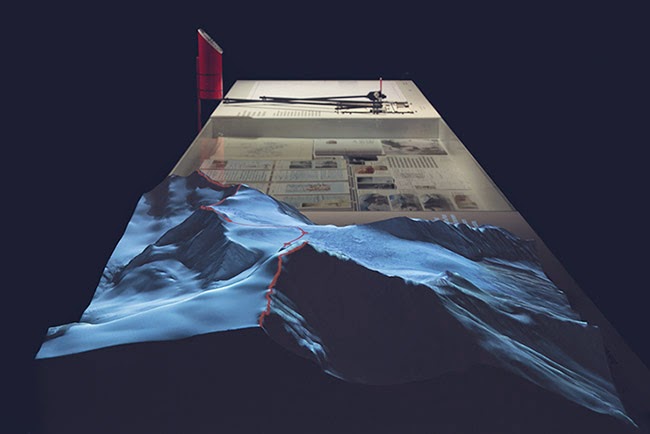
 [Images: “Cultivating the Map” by Danny Wills].
 [Image: “Cultivating the Map” by Danny Wills].


 [Images: “Cultivating the Map” by Danny Wills].


 [Images: “Cultivating the Map” by Danny Wills].


 [Images: “Cultivating the Map” by Danny Wills].
 [Images: “Cultivating the Map” by Danny Wills].


 [Images: “Cultivating the Map” by Danny Wills].


 [Images: “Cultivating the Map” by Danny Wills].
 [Image: From
  [Image: Due to glacial melt, Switzerland has actually grown in size since 1940; courtesy
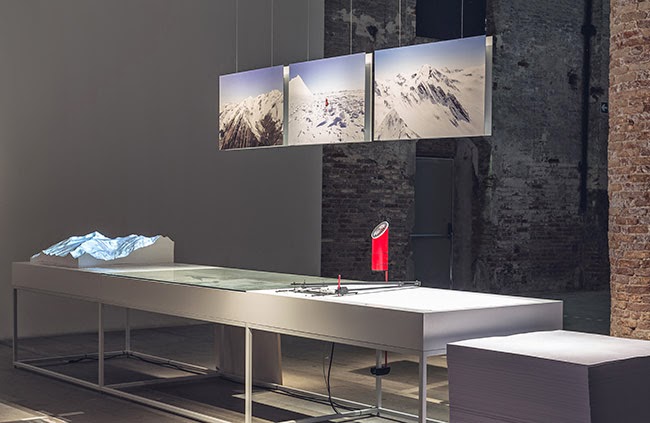
 [Images: From
 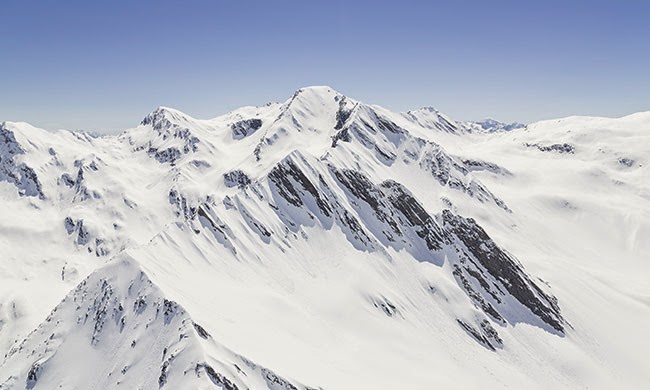 [Image: From
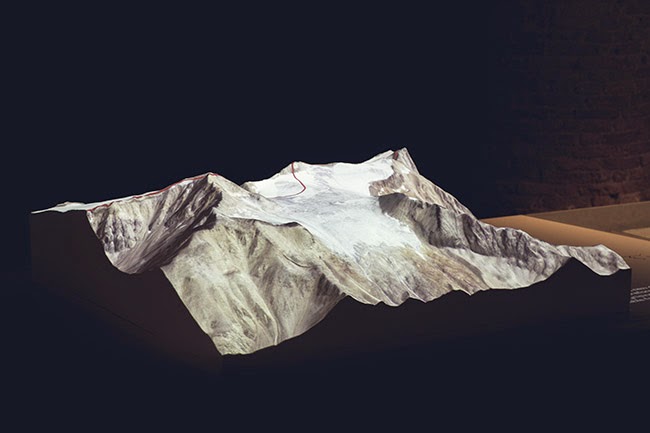
 [Images: From
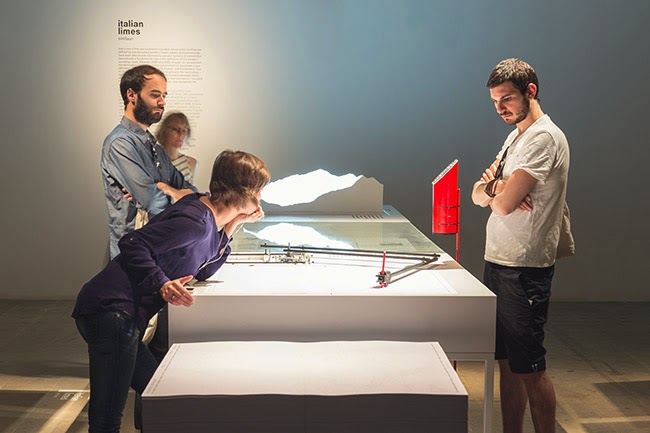
 [Images: From
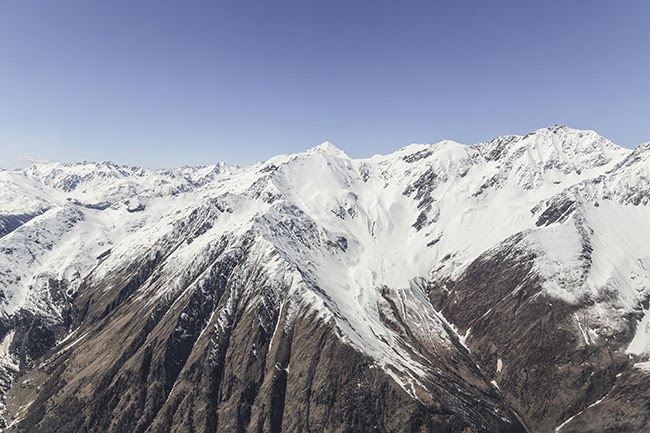
 [Images: From
 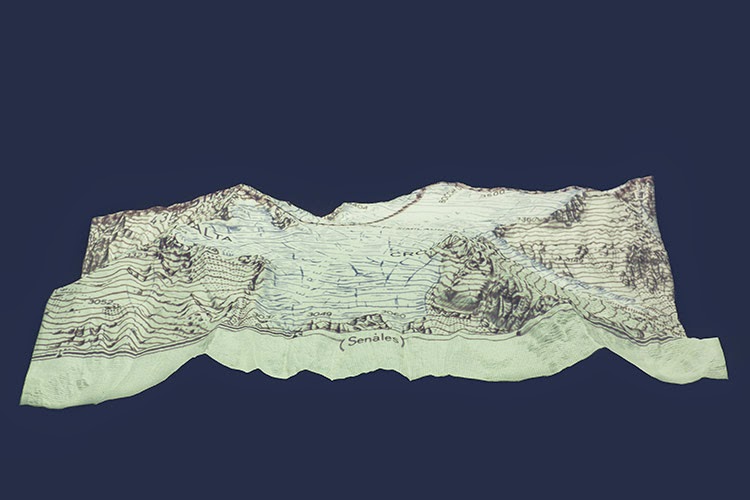 [Image: From
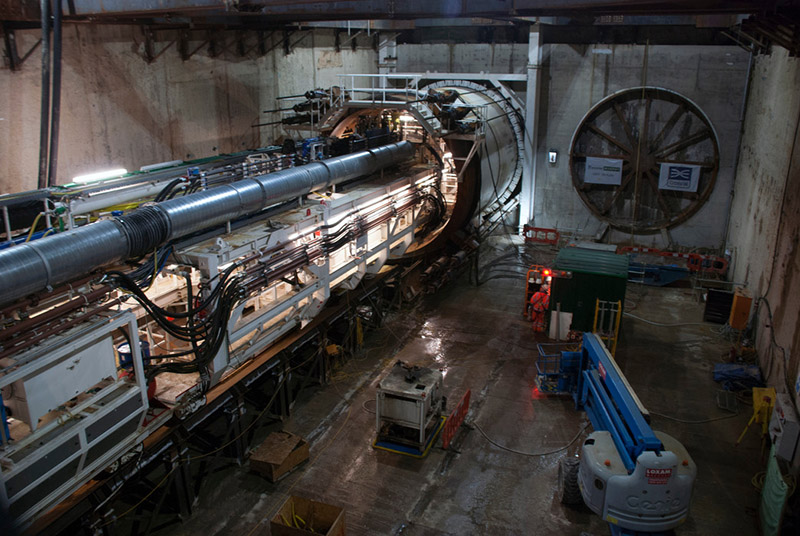 [Image: Machines slide beneath the streets, via
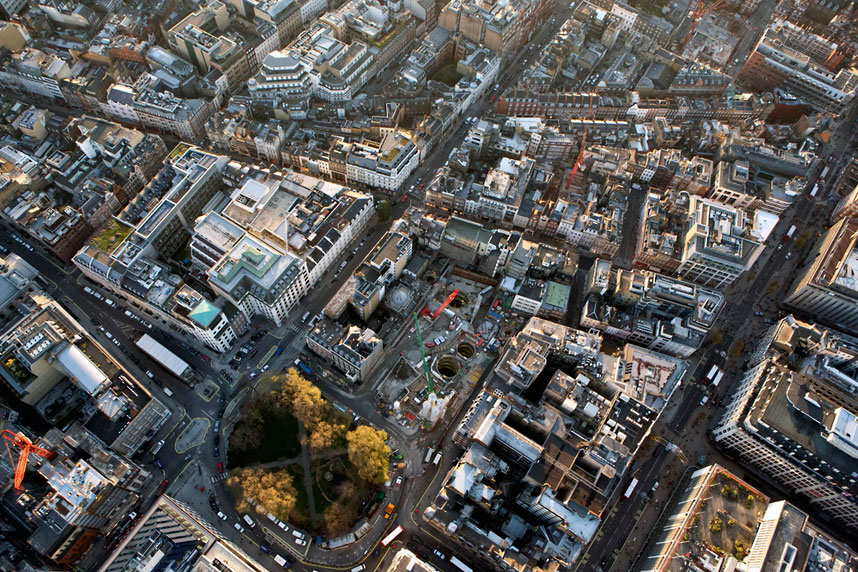

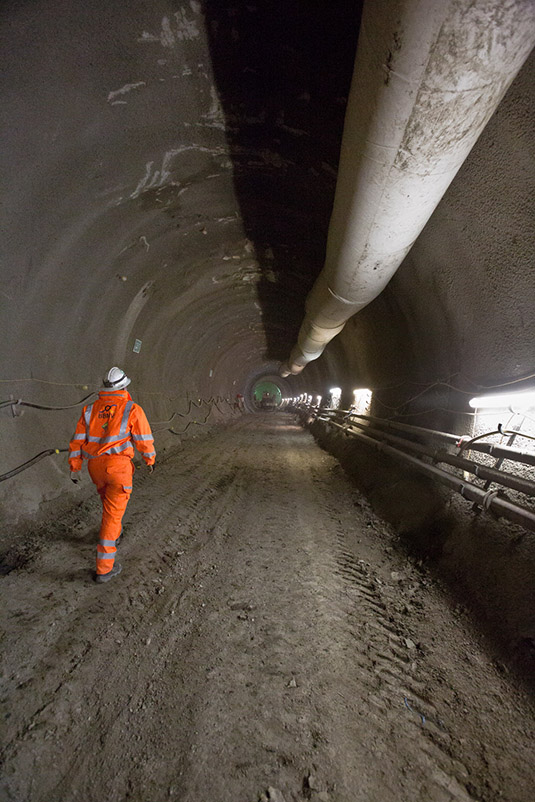 [Image: Looking down through shafts into the subcity, via
  [Image: Phyllis, via
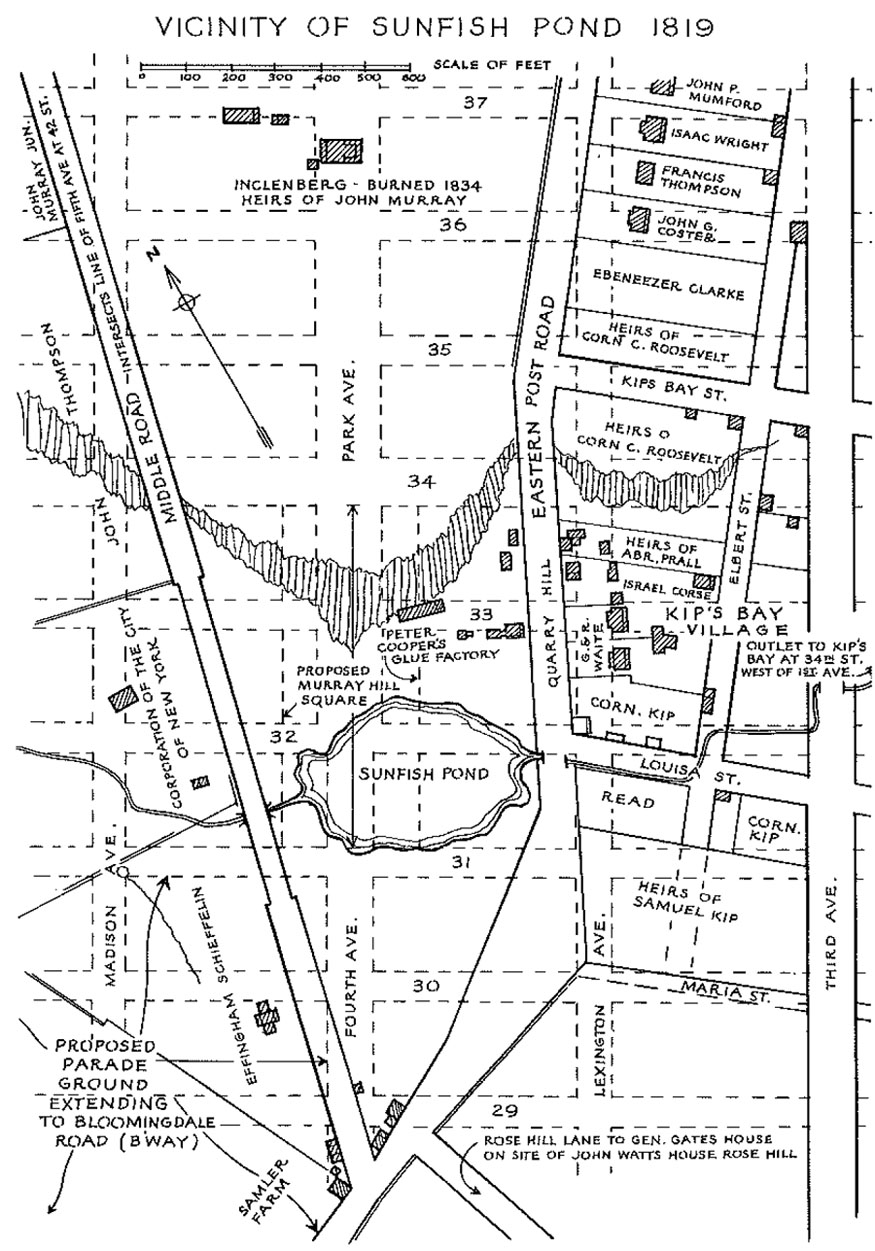 [Image: Sunfish Pond].
 [Image: Photo by
 [Image: Photo by