 [Image: “The Empty Quarter (Nevada)” (2021), collage by Geoff Manaugh, using maps from the U.S. Geological Survey.]
I’m thrilled to have some map collages in the latest issue of the Yale Review.
 [Image: “Groundwater Grids (North Dakota)” (2020), collage by Geoff Manaugh, using maps from the U.S. Geological Survey.]
I started making these during lockdown, as part of a larger (and, to be honest, now doomed-feeling) graphic novel project using public domain U.S. Geological Survey maps as the main material.

 [Images: “Keys II (Florida)” (2020) and “Keys I (Florida)” (2020), collages by Geoff Manaugh, using maps from the U.S. Geological Survey; the source maps for these are particularly interesting, because they utilize satellite photography.]
The images in this post include a few collages not published in the Yale Review, but click through for the full issue’s broad selection of poetry, essays, fiction, and more.

 [Images: “Morse Landscape II (Louisiana)” and “Morse Landscape I (Louisiana)” (2021), collages by Geoff Manaugh, using maps from the U.S. Geological Survey.]
And huge, huge thanks to Eugenia Bell for the editorial interest!


 [Images: Various collages by Geoff Manaugh, using maps from the U.S. Geological Survey.]
If you’re looking for someone to design a book cover or album cover or event poster, hit me up.
 [Image: “Terrestrial Astronomy (Nevada)” (2021), collage by Geoff Manaugh, using maps from the U.S. Geological Survey; it’s a pedestrian observation, but inverting the color scheme of geological maps makes them look like maps of stars.]
 [Image: Boston, courtesy of the
  [Image: A map of the
  [Image: A map of the
  [Image:
  [Image: Saxenburgh Island, from Andrew Pekler’s
  [Image: Antillia Island, from Andrew Pekler’s
  [Image: Hunter Island, from Andrew Pekler’s
  [Image: Screen-grab from
 [Image: From
  [Image: From
  [Image: From
 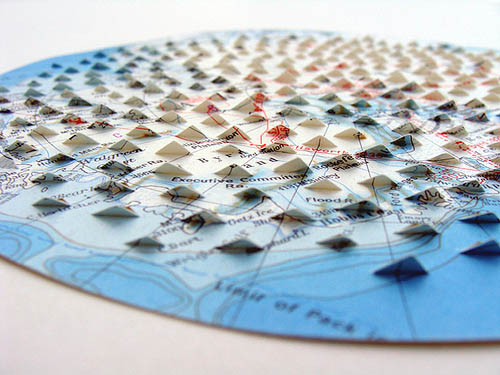 [Image: Work by
  [Image: Work by
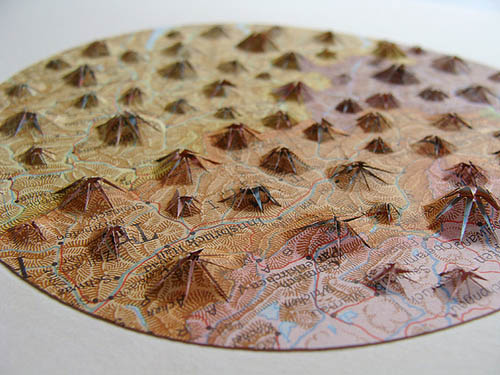

 [Images:
  [Image: By

 [Images: All works by
  [Image: By

 [Images: All works by
  [Image: Work by

 [Images: By