The Walled City (10-Mile Version)

[Image: “The Walled City (10-Mile Version)” by Andrew Kudless/Matsys].

A new exhibition opens next week at the Hubbell Street Galleries in San Francisco, part of the California College of the Arts, called Drawing Codes: Experimental Protocols of Architectural Representation. The idea behind the group show is to look at “the relationship between code and drawing” (emphases theirs), or “how rules and constraints inform the ways we document, analyze, represent, and design the built environment.”

Drawing Codes is curated by Andrew Kudless and Adam Marcus, with Clayton Muhleman, and it features work by Erin Besler, Elena Manferdini, Jimenez Lai, the Oyler Wu Collaborative, Rael San Fratello, and many more.

As Kudless—of Matsys fame—pointed out to me over email, the curators “gave all of the participants a set of codes that they had to follow (e.g. all black and white, orthographic projection, 25″ x 25″, etc.),” using this set of constraints to, among other things, foreground differences in approach between each participating architect.

If everyone’s doing the same thing, then how each person does it becomes more revealing.

[Image: “Half-Hearted Diamonds” by Jimenez Lai/Bureau Spectacular].

Perhaps ironically, it was actually the drawing by Kudless himself—which I first saw on Instagram—that caught my interest.

Called “The Walled City (10-Mile Version),” that project imagines an entire metropolis that is nothing but one, continuous wall.

Kudless explained that it came about by posing himself a rhetorical question: “What would a city look like if it was a wall and nothing else? I’ve been fascinated with walls that have grown thick enough to be buildings in themselves. From medieval European city walls to the Great Wall in China, there is something really interesting about taking something that is ostensively about separating two territories and turning into an inhabitable space in its own right.”

[Image: Close-up from “The Walled City (10-Mile Version)” by Andrew Kudless/Matsys].

The results: a rule-constrained exploration of how a wall could become a city.

I started to play around with slowly increasing a wall’s length while preventing it from moving outside a site or intersecting itself. At a certain point in the growth process, the wall takes over the entire site. There is still an inside and outside to the wall, but sometimes the outside is deep inside the site boundary or vice versa. At that point, I was left with a big squiggly wall, but realized that I needed some sort of roofscape to make it read as a city and not just a thick wall. That’s when I turned to Google’s autocomplete feature to give me suggestions on what programs [spatial functions] a rooftop might support. I worked my way from A to Z pretty much accepting whatever suggestion Google’s autocomplete gave me and started designing parametric definitions that could implement that program on a number of different sites along the wall’s top.

The various social and architectural functions distributed around the massive roofscape included, for example, Rooftop Antenna, Rooftop Bar, Rooftop Cafe, Rooftop Deck, Rooftop Exhaust, Rooftop Film, Rooftop Garden, Rooftop Hotel Pool, and so on.

Interestingly, Kudless also pointed out that, if he were to run the same generative script again, it would likely produce “a similar, but not identical city,” and it would almost certainly not result in a wall exactly ten miles in length (which, in this case, was purely a coincidence, he explained).

In any case, I’ve been impressed by Kudless’s work for a long time; check out these older posts on his projects Nevada Sietch and robotic drawing protocols, for example, and then stop by the exhibition when it opens next week. There will be a reception on January 19 at 5:30pm at 161 Hubbell Street. More info.

Covert Cartographics

[Image: Map Measuring Tool, CIA].

The U.S. Central Intelligence Agency has uploaded a massive set of images from their historic mapping unit to Flickr.

[Image: Triangular 24-Inch Engineering Scale, CIA].

The collections include state-of-the-art graphic tools for producing maps and other measured cartographic products, as well as the maps themselves. Organized by the decade of its production—including batches from the 1940s, 1950s, and 1960s—“each map is a time capsule of that era’s international issues,” as Allison Meier points out.

[Image: Terrain map of the Sinai Peninsula (1950s), CIA, CIA].

“The 1940s include a 1942 map of German dialects,” Meier writes, “and a 1944 map of concentration camps in the country. The 1950s, with innovative photomechanical reproduction and precast lead letters, saw maps on the Korean War and railroad construction in Communist China. The 1960s are punctuated by the Cuban Missile Crisis and Vietnam War, while the 1970s, with increasing map automation, contain charts of the Soviet invasion of Afghanistan, and the Arab oil embargo.”

[Images: The Austin Photo Interpretometer, CIA].

But it’s the mapping tools themselves that really interest me here.

On one level, these graphic devices are utterly mundane—triangular rulers, ten-point dividers, and interchangeable pen nibs, for example, any of which, on its own, would convey about as much magic as a ballpoint pen.

[Image: 10-Point Divider, CIA].

Nonetheless, there is something hugely compelling for me in glimpsing the actual devices through which a country’s global geopolitical influence was simultaneously mapped and strategized.

[Images: Rolling Disc Planimeter, CIA].

As the CIA points out, their earliest mapping division “produced some 8,000 hand-drawn maps and 64 plaster topographic 3-D models in support of the war effort. Many of their products played crucial roles in the planning and execution of major military operations in the European, North African, and Asian Theaters. On display here are just some of the many tools that OSS cartographers employed in their production process.”

[Image: Dietzgen Champion Drawing Instruments, CIA].

In a sense, it’s not unlike seeing the actual typewriter with which a particular author wrote her novels, or the battered, handheld sketchbooks a painter once carried with him to a distant mountaintop—only here, in art historical terms, we are looking at the graphic tools and visual documents through which a country’s overseas influence was realized and maintained.

It is a narrative of covert state power as relayed through cartographic objects, the outlines of an imperial nation-state arising from them like a ghost.

[Image: Stanley Improved Pantograph, CIA].

I’m reminded of one of my favorite books on the subject of geopolitics, literally understood: Rachel Hewitt’s Map of a Nation: A Biography of the Ordnance Survey.

Among other things, Hewitt’s book reveals the often deeply strange tools—including surreal glass rods—through which British mapmakers and other agents of terrestrial exploration measured their nascent empire, helping to transform landscape into a mathematized system of coordinates and, in the process, conveying to British authorities the exact volumetric extent of their political domain.

There was the empire, in other words—but there were also these exotic objects of measurement through which that same empire was conjured, as if through cartographic magic.

[Image: Keufel & Esser 20.5-inch Slide Rule, CIA].

In any case, check out more at the CIA’s “Cartography Tools” Flickr set.

(Originally spotted via Alessandro Musetta).

Art Arm

[Image: “Untitled #13,” from “Scripted Movement Drawing Series 1” (2014) by Andrew Kudless].

San Francisco-based designer and architect Andrew Kudless is always up to something interesting, and one of his most recent projects is no exception.

For a new group of small works called “Scripted Movement Drawing Series 1” (2014), Kudless is exploring how robots might make visual art—in this specific case, by combining the instructional art processes of someone like Sol Lewitt with the carefully programmed movements of industrial machinery.

[Image: The robot at work, from “Scripted Movement Drawing Series 1” (2014) by Andrew Kudless].

In Kudless’s own words, “The work is inspired by the techniques of artists such as Sol Lewitt and others who explored procedural processes in the production of their work. The script, or set of rules, as well as the ability or inability of the robot to follow these instructions is the focus of the work. There is almost a primitive and gestural quality to the drawings created through the tension between the rules and the robot’s physical movement. Precisely imprecise.”

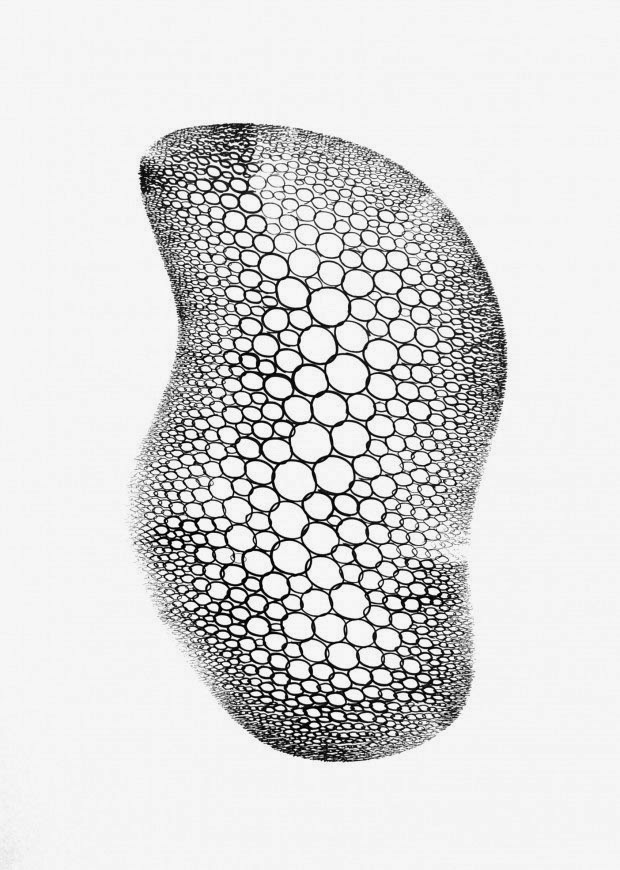
[Image: “Untitled #16,” from “Scripted Movement Drawing Series 1” (2014) by Andrew Kudless].

These giant robot arms, he continues, “are essentially larger, stronger, and more precise version of the human arm. Made up of a series of joints that mimic yet extend the movements of shoulder, elbow, and wrist, the robot has a wide range of highly control[led] motion. The real value of these robots is that, like the human arm, their usefulness is completely determined by the tool that is placed in its hand.”

So why only give robots tools like “welding torches, vacuum grippers, and saws,” he asks—why not give them pencils or brushes?

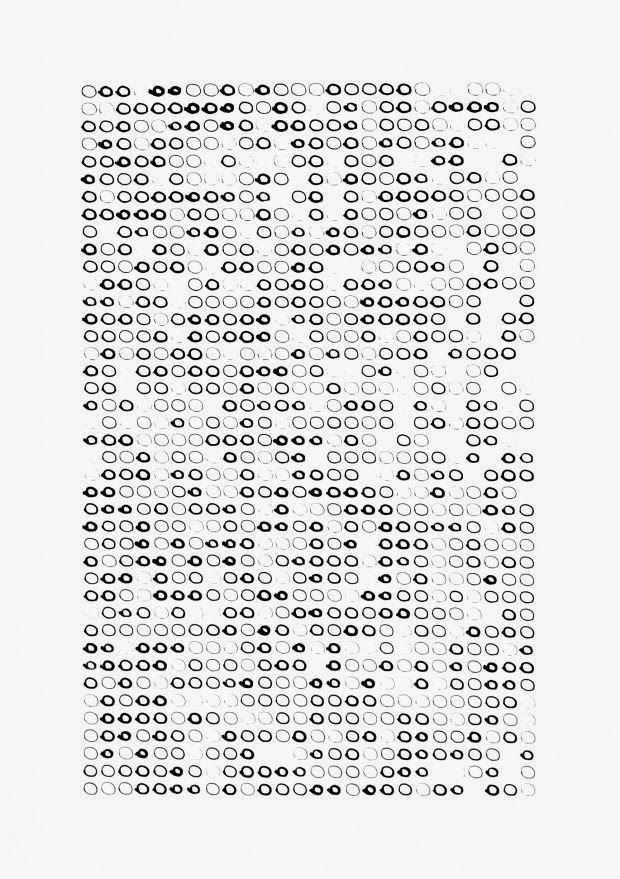
[Image: “Untitled #6 (1066 Circles each Drawn at Different Pressures at 50mm/s),” from “Scripted Movement Drawing Series 1” (2014) by Andrew Kudless].

The results are remarkable, but it’s specifically the unexpected combination of Lewittian instructional art with industrial robotics that I find so incredibly interesting. After all, Kudless ingeniously implies, it has always been the case that literally all acts of industrial assembly and production are, in a sense, Sol Lewitt-like activities—that conceptual art processes are hiding in plain sight all around us, overlooked for their apparent mundanity.

It’s as if, he suggests, every object fabricated—every car body assembled—has always and already been a kind of instructional readymade, or Sol Lewitt meets Marcel Duchamp on the factory floor.

With these, though, Kudless throws in some Agnes Martin for good measure, revealing the robot arms’ facility for minimalist lines and grids in a graceful set of two-dimensional drawings.

[Image: “Untitled #7 (1066 Lines Drawn between Random Points in a Grid),” from “Scripted Movement Drawing Series 1” (2014) by Andrew Kudless].

Kudless explains that “each of the works produced in this series was entirely programmed and drawn through software and hardware”:

None of the lines or curves was manually drawn either within the computer or in physical reality. Rather, I created a series of different scripts or programs in the computer that would generate not only the work shown here, but an infinite number of variations on a theme. Essential to the programming was understanding the relationships between the robot and human movement and control. Unlike a printer or plotter which draws from one side of the paper to the other, the robot produces the drawings similarly to how a human might: one line at a time. The speed, acceleration, brush type, ink viscosity, and many other variables needed to be considered in the writing of the code.

Various drawing styles were chosen to showcase this.

[Image: “Untitled #15 (Twenty Seven Nodes with Arcs Emerging from Each),” from “Scripted Movement Drawing Series 1” (2014) by Andrew Kudless].

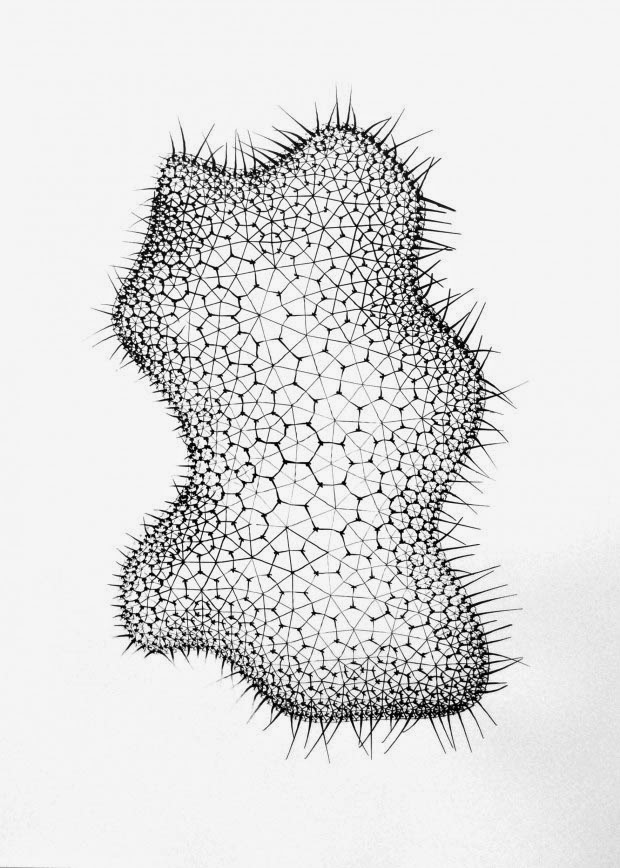
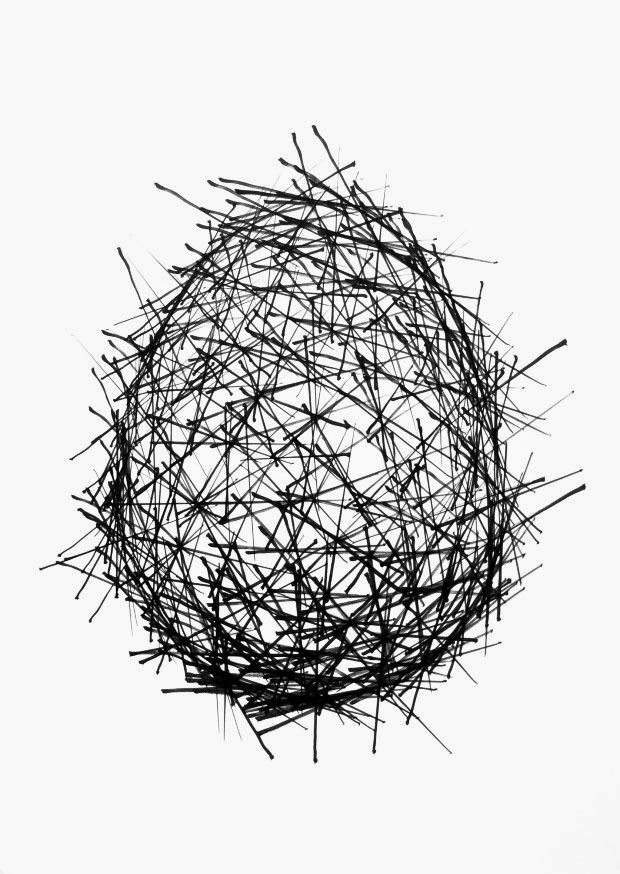
[Image: “Untitled #3 (Extended Lines Drawn from 300 Points on an Ovoid to 3 Closest Neigh[bor]ing Points at 100mm/s)” (2014) from “Scripted Movement Drawing Series 1” (2014) by Andrew Kudless].

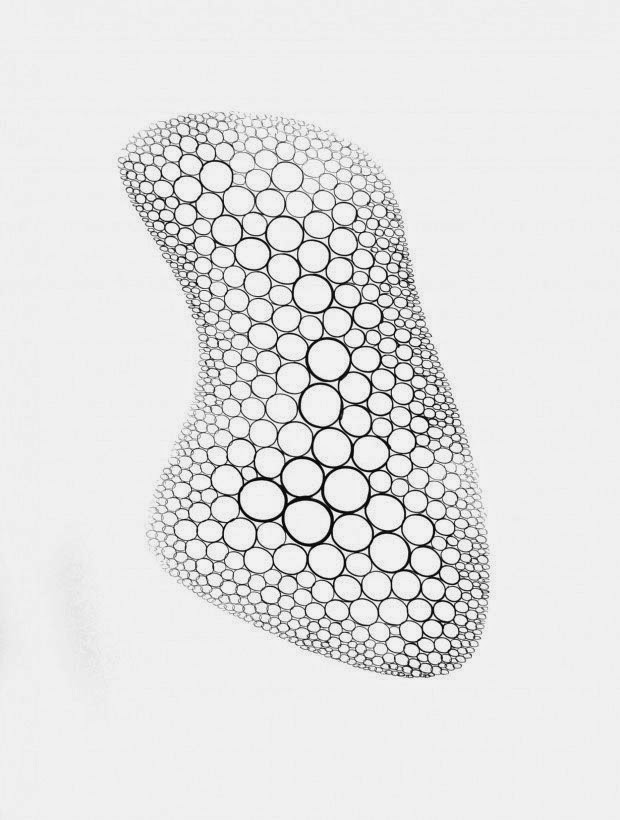
[Image: “Untitled #12,” from “Scripted Movement Drawing Series 1” (2014) by Andrew Kudless].

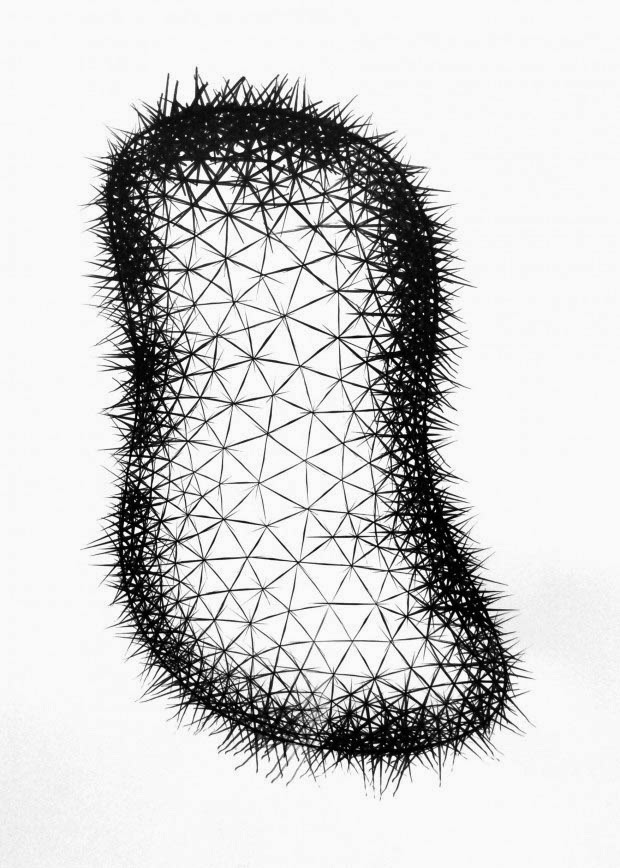
[Image: “Untitled #14,” from “Scripted Movement Drawing Series 1” (2014) by Andrew Kudless].

There are many more drawings visible on Kudless’s website, and I am already looking forward to “Scripted Movement Drawing Series 2.”

You can also purchase one of the prints, if you are so inclined; contact the Salamatina Gallery for more information.

(Very vaguely related: Robotism, or: The Golden Arm of Architecture).